Nvidia has been a lightning rod of attention as it surged to parabolic highs over the past several weeks.
This surge also helped lead semiconductors stocks higher, along with the Nasdaq Indices.
So what’s next for this high-flier?
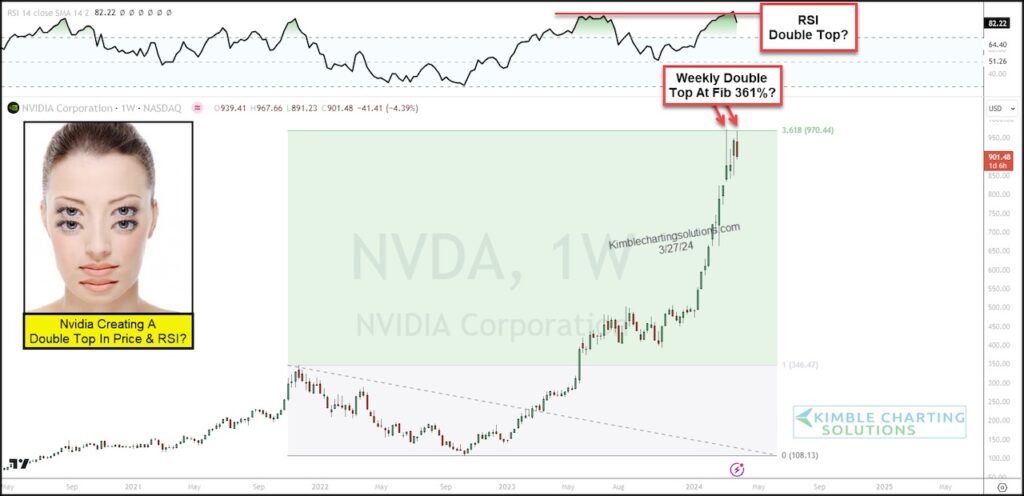
Below is a “weekly” chart of Nvidia (NVDA) highlighting its steep advance.
As you can see, NVDA surged to its 361% Fibonacci extension level before stalling out. Two long wicks produced at this key Fibonacci resistance level could be hinting at a double top… as the Relative Strength Indicator (RSI) could also be making a double top.
We will have to wait to see if there is any follow through selling. If not, NVDA could break out of this pattern to new highs.
Will price action turn lower in a decisive fashion from here? Or will price break out for another leg higher? Stay tuned!
$NVDA Nvidia “weekly” Stock Chart
Note that KimbleCharting is offering a 2 week Free trial to See It Market readers. Just send me an email to services@kimblechartingsolutions.com for details to get set up.
Twitter: @KimbleCharting
The author may have a position in mentioned securities. Any opinions expressed herein are solely those of the author, and do not in any way represent the views or opinions of any other person or entity.

: Where’s the Deflation in This?")


: Where’s the Deflation in This?")
