One of the bull market leaders of the past 14 years is trading into critical resistance.
And what happens next could decide the next turn for tech stocks.
That’s right, we are talking about Semiconductors… again. We have routinely highlighted key moments across various time frames for the Semiconductors Sector ETF (SMH) because this sector has been a stalwart of the bull market.
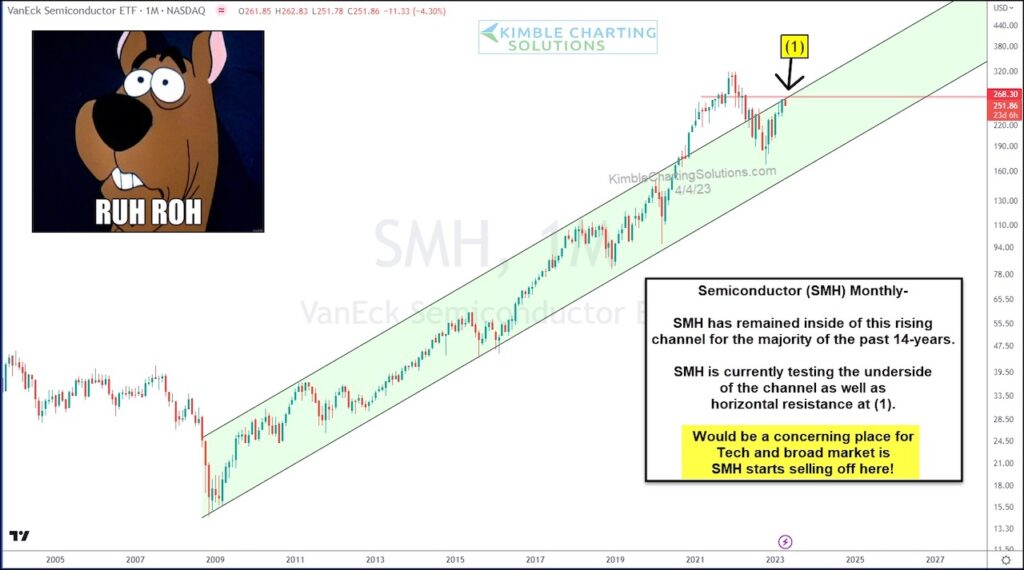
Well, as you can see in the “monthly” chart below, $SMH has been trading in a bull market trend for over the past decade. And it has spent much of that time in a rising trend channel.
That said, price briefly broke out above the channel before falling back into the channel (after a bearish reversal). And it is now retesting the upper end of the trend channel at (1). This resistance area is also fortified by horizontal resistance from the prior’s bearish reversal pattern breakdown.
So let’s just say that this is a place of interest for bulls and bears. And it would be quite concerning for tech and the broader stock market if the Semiconductors started selling off form here. Stay tuned!
$SMH Semiconductors ETF “monthly” Chart
Note that KimbleCharting is offering a 2 week Free trial to See It Market readers. Just send me an email to services@kimblechartingsolutions.com for details to get set up.
Twitter: @KimbleCharting
Any opinions expressed herein are solely those of the author, and do not in any way represent the views or opinions of any other person or entity.


 Set For Revival?")


 Set For Revival?")
