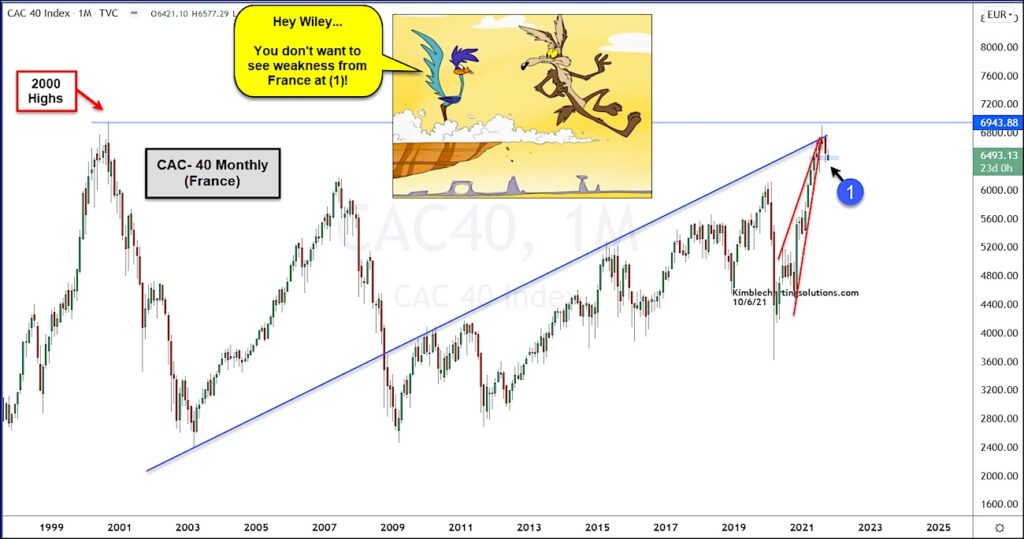
The French stock market has been very strong this year, with the CAC 40 Index streaking higher into late summer.
But the rally fizzled out at a key spot, leaving the index vulnerable to a correction.
Today’s “monthly” chart of the CAC 40 Index highlights this. As you can see, the steep rally created a sharp rising wedge pattern that culminated in a test of (and reversal at) the 2000 highs. That reversal left “Wiley” standing on thin air!
The CAC 40 has subsequently broken down and out of the rising wedge pattern and is testing lateral support at (1).
French stock market bulls better hope that the Index can turn higher from here… otherwise, “Wiley” might be headed for a fall! Stay tuned!
CAC 40 Index “monthly” Chart
Note that KimbleCharting is offering a 2 week Free trial to See It Market readers. Just send me an email to services@kimblechartingsolutions.com for details to get set up.
Twitter: @KimbleCharting
Any opinions expressed herein are solely those of the author, and do not in any way represent the views or opinions of any other person or entity.


: Where’s the Deflation in This?")


: Where’s the Deflation in This?")
