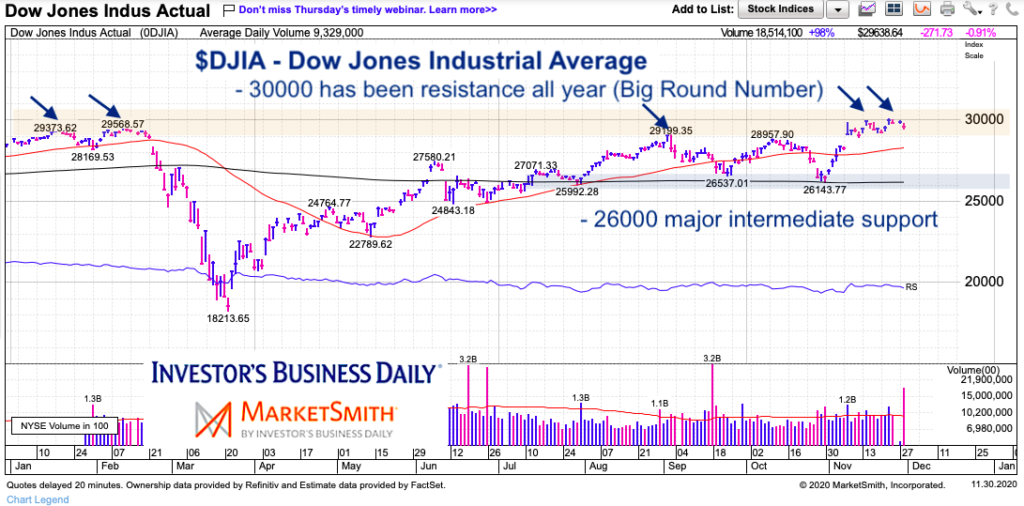
Just as the Dow Jones Industrial Average was nearing 30000 earlier this year, coronavirus hit and the markets crashed. From there a remarkable recovery has taken place.
And guess where the Dow Industrials are back to? You got it – 30,000.
In fact, the Dow Industrials poked up near 30,000 in September and October before pulling back. And here we are again today, trading a little above or below 30,000.
The level may not be a major indicator – that is not my point – but it is something on investors minds. And this means it factors into price as mental resistance. Pretty simple chart image message today, but note some additional intermediate term analysis below.
Note that the following MarketSmith charts are built with Investors Business Daily’s product suite.
I am an Investors Business Daily (IBD) partner and promote the use of their products. The entire platform offers a good mix of technical and fundamental data and education.
Dow Jones Industrial Average “daily” YTD Chart
So the big round 30,000 number stands as resistance. I’d give that a +/- 1000 points – just as we saw 29,000 and change get rejected earlier this year, we could see bulls break higher into newfound territory before getting magnetized back to this level. Right now 26,000 to 26,500 is a band of very strong support. As long as that holds, bulls are in control.
Twitter: @andrewnyquist
The author may have a position in mentioned securities at the time of publication. Any opinions expressed herein are solely those of the author, and do not in any way represent the views or opinions of any other person or entity.


