3 decades ago, the Nikkei 225 Index was peaking around the 40,000 level. The Japanese economy was very strong and a bubble in Japanese stocks was forming (and about to burst).
The ensuing crash was devastating – it took nearly 2 decades for the Nikkei 225 to bottom and the economic fallout was long-lasting. The once super-strong Japanese market had become irrelevant, merely dead to global investors.
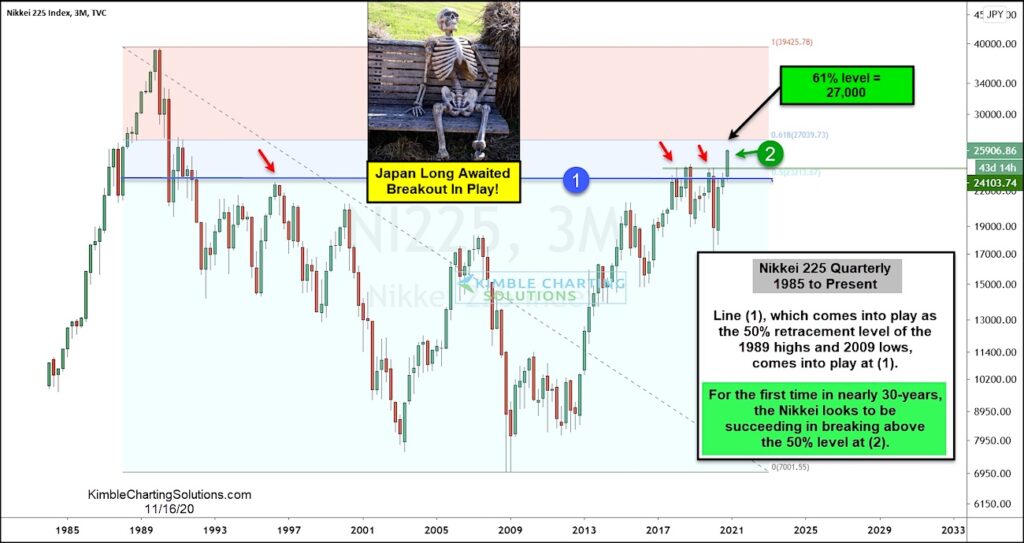
BUT, as today’s chart shows, the Japanese stock market is making a comeback… and investors need to pay attention here!
The past 3 years has seen the Nikkei 225 test its 50 percent Fibonacci retracement level (resistance) multiple times at (1).
And for the first time in nearly 30 years, the Nikkei looks to be succeeding in breaking above the 50% Fib level at (2). The next level of importance is 27,000 and the 61.8 Fib. There’s lots of room to rally above that level.
Is the Nikkei 225 back from the dead? Stay tuned!
Note that KimbleCharting is offering a 2 week Free trial to See It Market readers. Just send me an email to services@kimblechartingsolutions.com for details to get set up.
Twitter: @KimbleCharting
Any opinions expressed herein are solely those of the author, and do not in any way represent the views or opinions of any other person or entity.

 Vying For Stock Market Leadership Role")
 Current Price Analysis and Future Considerations")

 Current Price Analysis and Future Considerations")
 Vying For Stock Market Leadership Role")
