The U.S. stock market has put together a multi-day rally and is attempting to breakout to new highs.
The S&P 500 Index is back over 3000 and much will be determined short-term as to whether the index breaks out to new highs or not.
Today I share charts of the S&P 500 Index and Russell 2000 Index.
They are annotated with my current thoughts and analysis and what I think it would take to turn these indices bullish.
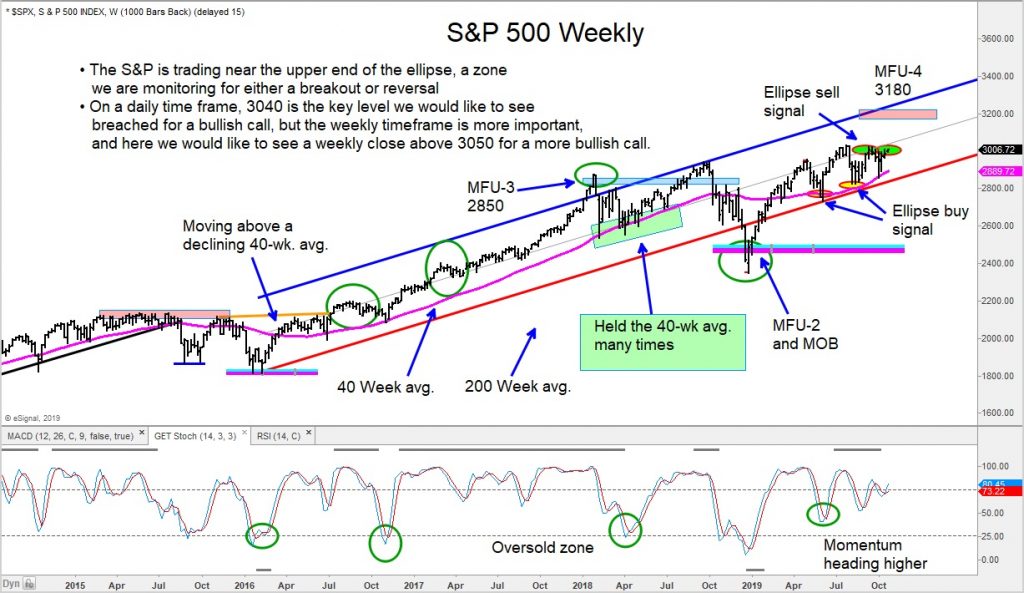
S&P 500 Index
The broad market index is trading back at the upper end of the ellipse zone. We are monitoring for either a breakout or a reversal here on a “weekly” closing basis.
On a daily time frame, we are watching 3040 as key breakout level.
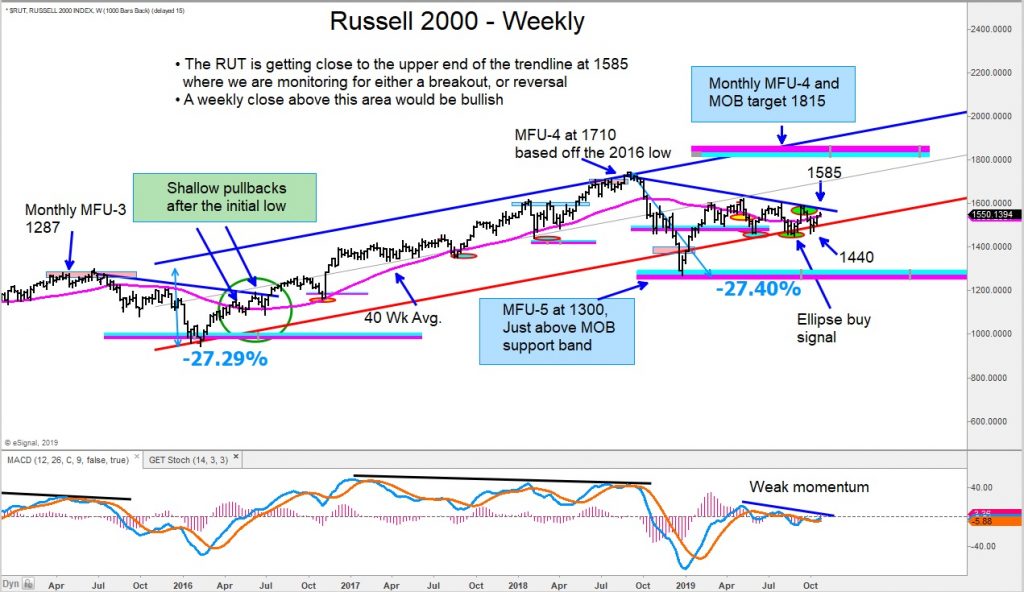
Russell 2000 Index
The small cap index is lagging other large cap indexes like the S&P 500. However, the Russell 2000 is trading near its downtrend line. A breakout here would be important for the broader market. See chart for more analysis.
The author may hold positions in mentioned securities at the time of publication. Any opinions expressed herein are solely those of the author, and do not in any way represent the views or opinions of any other person or entity.


