A while back I did a Daily blog on this ratio.
Since then, Gold (NYSEARCA: GLD) rallied up to $1330 an ounce (give or take.)
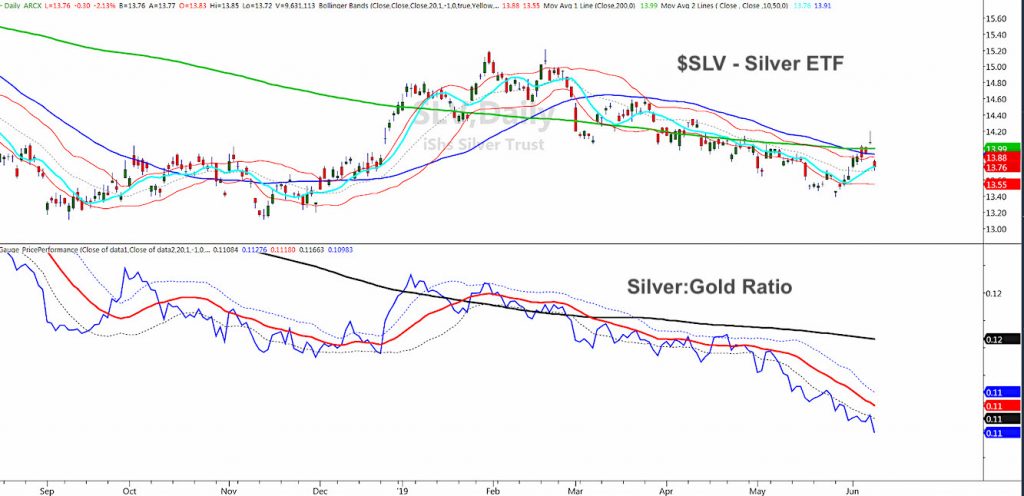
Silver (NYSEARCA: SLV) rallied up to $14.05
The bullish articles and tweets have lit up my computer screen.
Here’s an excerpt from one:
All things considered, the bull case for gold has massively strengthened. We are seeing USD weakness as economically underperforming regions are not able to push the USD up. Additionally, we are at the end of a hiking cycle with at least 2 implied rate cuts in the midterm.Leo Nelissen
Yet, today, gold fell to $1253 an ounce and silver dropped to $13.77.
Believe me, as a former gold and silver commodities trader on the NY Exchange, I am itching to get long.
Now, we did take a position in $GDX – Gold Miners (which we have already taken half off with a nice profit and with a no loss stop on the balance).
But that trade was meant to be more active. Not a marriage so-to-speak.
Until we see the ratio between gold and silver reverse, why have we kept you out of those two metals?
The statement that Mr. Nelissen makes could very well turn out to be true.
However, to date, the dollar is holding key support.
The Federal Reserve has initmated that they could lower rates, but we have yet to see any real action.
The “itch” to buy the bottom plagues many traders. I can understand why. The risk would be minimal while the reward could be highly profitable.
That is of course, if one actually nails the bottom.
Nevertheless, at this time, these type of statements on the dollar and monetary policy are NOT reflected in the SLV:GLD ratio chart.
The top chart is of silver or SLV. We use a weekly chart to gauge longer-term trend reversals. SLV has not cleared the 50-week moving average since early in 2019.
And even after it did, it could not clear the 200-WMA.
The bottom chart shows the gold:silver ratio.
The black dotted line is the bollinger band. The red line is the 20-day moving average. The solid black solid above is the 125-day moving average.
Except for a couple of tests of the lower bollinger band, this chart does not look like silver is about to outperform gold anytime soon.
And that scenario is exactly what we need to see before thinking that a potential drop in dollar and yields will spark some kind of inflationary reaction in the metals.
Til then, not so fast gold bulls!
Every Tuesday and Thursday, I will be on KKOB radio at around 6:15 PM mountain time (8:15 PM EST) to discuss markets and market news. https://www.iheart.com/live/770-kkob-5411/
Plant Your Money Tree made it to the Best New Wealth Books

I’m happy to announce that my book, “Plant Your Money Tree: A Guide to Growing Your Wealth”, made it to BookAuthority’s Best New Wealth Books:
https://bookauthority.org/books/new-wealth-books?t=ipp94p&s=award&book=153812257X
BookAuthority collects and ranks the best books in the world, and it is a great honor to get this kind of recognition. Thank you for all your support!
The book is available for purchase on Amazon.
S&P 500 (SPY) – Most of the most important instruments rallied right into resistance today. SPY though, cleared it. Does that matter? Only if the others play catch up and quick. 286.90 the 50-DMA is super pivotal.
Russell 2000 (IWM) – 152.75-153.35 is where the resistance lies. 151.65-the high 2 weeks ago-is pivotal and 149 the support.
Dow Jones Industrials (DIA) – 260.10 the ever so important pivotal level.
Nasdaq (QQQ) – After running up over it, this closed under 183.41 the 50-DMA. And, if this cannot hold 179.75, look for a move back down to around 175.
KRE (Regional Banks) – 51.40 support. Overhead resistance at 53.50
SMH (Semiconductors) – 105.50 important support to hold. 109.40 the 50 DMA.
IYT (Transportation) – Ran right into the EMA resistance at 186.50. 185.75 pivotal support to hold.
IBB (Biotechnology) – 103.15 pivotal support 104.89 the high to clear if good.
XRT (Retail) – 42.21 the major resistance with now, 40.00 big support.
Twitter: @marketminute
The author may have a position in the mentioned securities at the time of publication. Any opinions expressed herein are solely those of the author, and do not in any way represent the views or opinions of any other person or entity.
")


")