Today, the GDP came out at 3.1%, after last quarter’s number was 3.2%.
I am not one that relies too much on any one economic statistic.
Nor do I completely trust that those numbers won’t change in time.
However, the GDP is one number I talk about a lot.
Why?
Because three of the six of my economic Modern Family members represent aspects of the GDP.
Furthermore, they are incredibly accurate in showing us the technical picture of the GDP, well before the actual number becomes public.
What is the GDP, and how do Granny Retail, Granddad Russell 2000 and Tran Transportation tell us (mostly) everything we need to know?
What is the GDP?
It is the total value of goods produced and services provided in a country during one year.
In other words, the GDP is a broad measure of the size of the economy and it’s rate of growth.
How is the GDP measured?
Basically, it is measured by consumer spending (Granny Retail XRT), which makes up the biggest component (about 2/3).
Another part of the number is calculated by government spending. For example, infrastructure. (Transportation IYT.)
Yet another part of the number is calculated by business expenditures or how much businesses spend or invest on things like machinery or employing people. (Some of this is taken from the S&P 500, yet the Russell 2000 IWM, is a better gauge of how US domestic companies are doing).
The rest of the number (and smallest amount) is based on net exports, or the goods and services made in a country that are exported to other countries minus the imports that a country brings in. Exports-Imports=net exports. (IWM IYT and XRT)
Of course, I am oversimplifying. However, since it is mainly looking back at the last quarter, here is where the charts on IWM XRT and IYT help big time.
GDP peaked in 2018 at over 4%. Today, the number was 3.1%, slightly better than the 3% expected.
But again, that is looking back to the first quarter. What did the market do then?
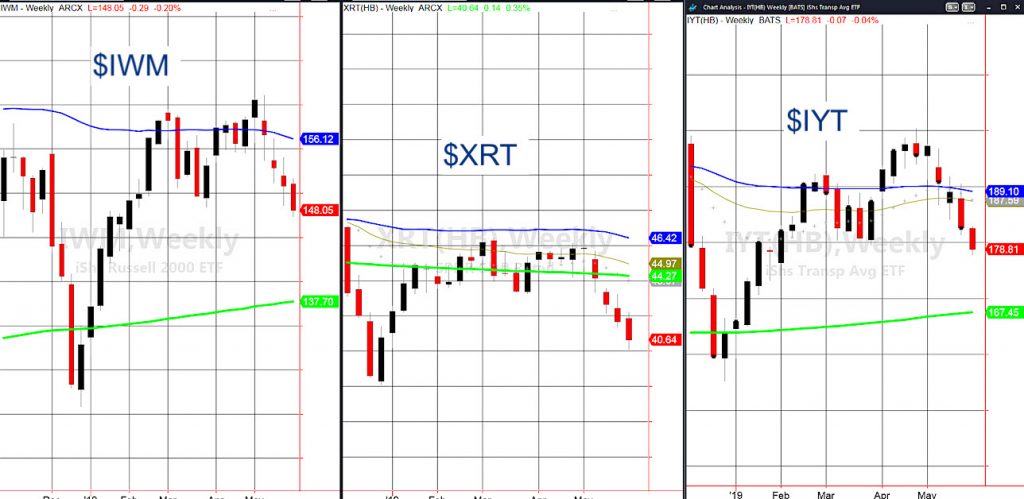
Looking at the weekly charts, the first quarter was the start of a rally after the December dump.
IWM went briefly back into a weekly bullish phase (the blue line.) Transportation IYT did as well, and lasted there longer.
Granny Retail XRT, tried to rally, but never quite made it above the blue line or 50-week moving average.
Fast forward to today. A month ago, IWM fell below the 50-WMA and back into a caution phase. 3 weeks ago, Transportation IYT did the same.
And XRT (2/3 of the GDP) broke into a distribution phase (when the price is below the blue and green line 200-WMA).
These charts do not paint a rosy picture going forward for the market or the economy.
What should we do about it?
What happens to the GDP when manufacturing, distribution of goods and services and consumer spending are falling?
The dreaded “R” word for one, falling yields as we are seeing now for two, and eventually, a bigger hit to our IRAa and 401(k)s.
Every Tuesday and Thursday, I will be on KKOB radio at around 6:15 PM mountain time (8:15 PM EST) to discuss markets and market news. https://www.iheart.com/live/770-kkob-5411/
Want summer reading? Please check out my book, now back in stock on Amazon: Plant Your Money Tree: A Guide to Growing Your Wealth! Also on Kindle! Go here: www.marketgauge.com/plantyourmoneytree to receive a special $97 bonus for free while it lasts!
S&P 500 (SPY) – 277 or where the MAs sit essentially held again today. Now, it must show us it can at least get back over 280.
Russell 2000 (IWM) – Would have preferred to see this close over 148.41 the March low. Weakness will be reversed if this can clear 150
Dow Jones Industrials (DIA) – Now 253.44 is the place to clear.
Nasdaq (QQQ) – If there is going to be any pockets of strength, it will be in this index, especially if it can clear 177.50
KRE (Regional Banks) – Wild day again. Only this time, it failed the 200-WMA at 51.40. Should it fail to take back that level tomorrow, not good.
SMH (Semiconductors) – 101.15 the 200-DMA resistance to clear if good.
IYT (Transportation) – The 180 support became resistance. Now must clear and hold if good.
IBB (Biotechnology) – Broke the 200-WMA at 103.14. Did hold 101-so there is the range to watch.
XRT (Retail) – Support around 40.00 with resistance at 42.00
Twitter: @marketminute
The author may have a position in the mentioned securities at the time of publication. Any opinions expressed herein are solely those of the author, and do not in any way represent the views or opinions of any other person or entity.


