The S&P 500 index has gotten off to a hot start in 2019, so I decided to dive in and see just how hot the stock market has been on a historical basis.
And what it may mean.
On a closing basis, I calculated the rolling drawdown (peak to trough) and the return for each year through the first week in April starting since 1960.
Using a profit to drawdown ratio of those two values, 2019 ranks as the fourth best year since 1960.
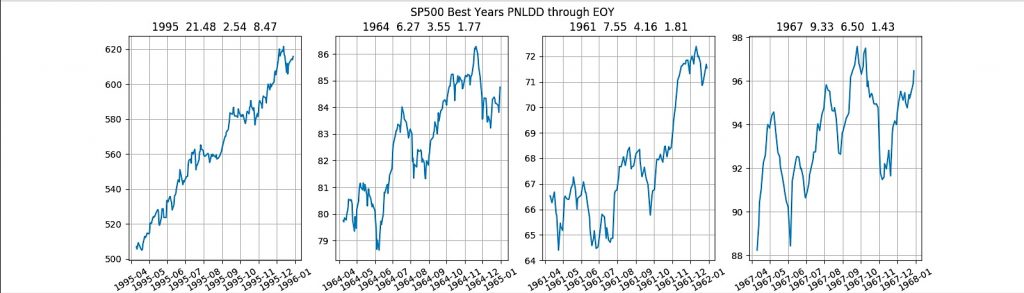
Here is a quick list of the top years and conversely a snapshot of the bottom years
1995 +8.19
1964 +7.71
1961 +6.77
2019 +6.15
1967 +5.08
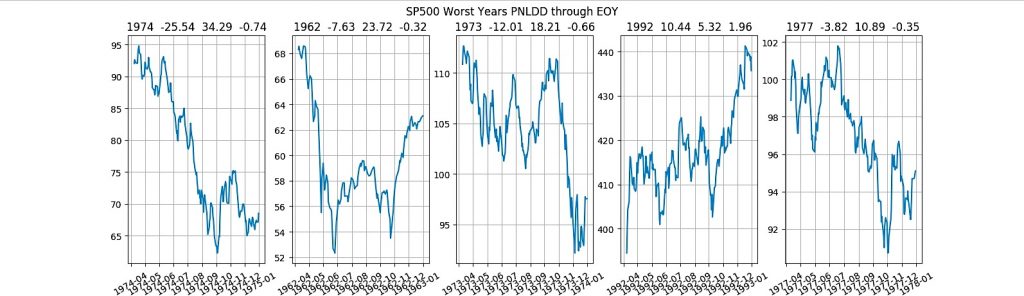
1977 – (0.95)
1992 – (0.87)
1973 – (0.84)
1962 – (0.69)
1974 – (0.63)
Of course we cannot capture the bullish strength through the first week of April at this point. So how did the top years do from April onward? Across the top of the chart you can see the year, the percentage return from the first week of April until year end, the peak to trough drawdown from the first week of April until year end, and the profit to drawdown ratio from the first week of April until year end.
And the worst performing years?
“Significant” years like 1999,2000,2007,2008 all ranked in the middle for what it is worth. 1987 was actually the 6th best year on the list in terms of return to drawdown after the first week of April. If you feel like we’ve been on a one-way train… that is because we have been. But is it all aboard (or whatever train conductors say)? The next graph shows the performance from Jan 1 to the first week of April on the x-axis and the y-axis contains the rest of the year.
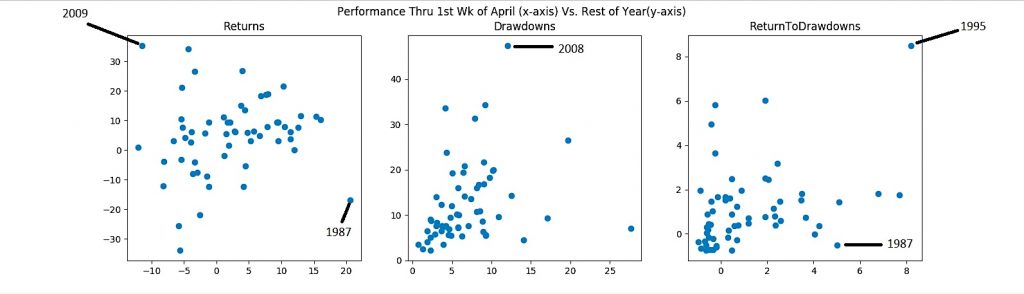
The big takeaway is the ‘dead space’ above 6 on the x-axis on the farthest right chart. It says that based on the 6 (2019’s return to drawdown from Jan 1 through the first week of April) we should not expect to perform at a similar clip for the remainder of the year. It is possible, but there is not much data to lend confidence to that hypothesis.
Twitter: @DBurgh
No position in any of the mentioned securities at the time of publication. Any opinions expressed herein are solely those of the author, and do not in any way represent the views or opinions of any other person or entity.

: Where’s the Deflation in This?")


: Where’s the Deflation in This?")