After fielding a bunch of client questions about the recent market pullback, I thought I’d share our analysis and outlook.
In the S&P 500 Index (SPX) chart below, we highlight key price levels and what we are seeing.
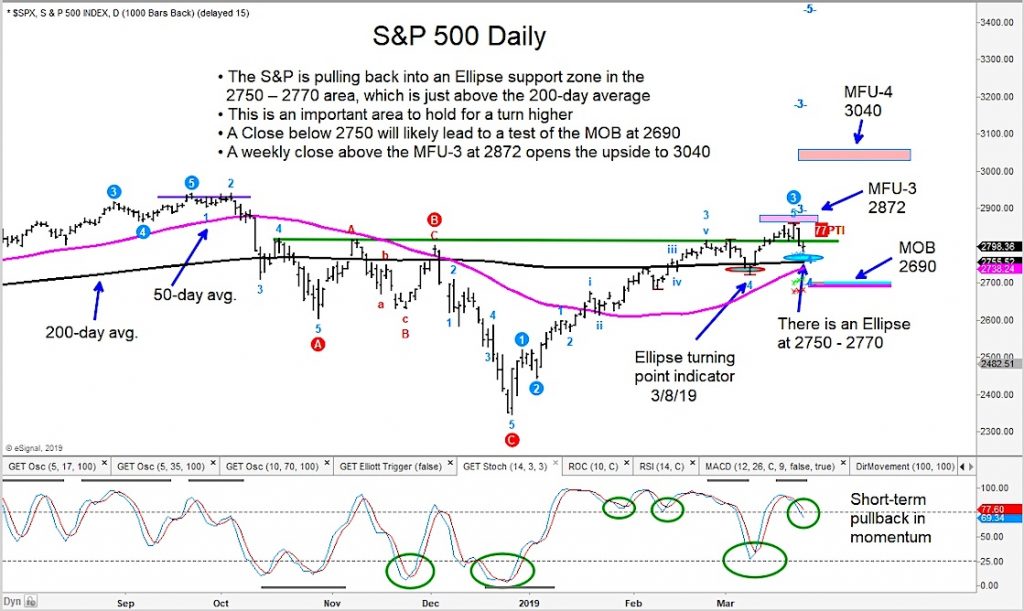
The S&P 500 pullback touched down near an Ellipse support zone near 2750-2770.
This is an important area to hold for a turn higher.
A close below 2750 would open the door for a test of 2690.
But at the same time, a weekly close above 2872 would open the door for further upside to 3040.
S&P 500 Index “daily” Chart
Author may have positions in mentioned securities at the time of publication. Any opinions expressed herein are solely those of the author, and do not in any way represent the views or opinions of any other person or entity.


