The stock market reached a critical point in time and price last fall.
This lead to a sharp correction on the S&P 500 and other broad U.S. stock market indices.
And though the rally has been similarly sharp, investors still face an important question: Are the lows in?
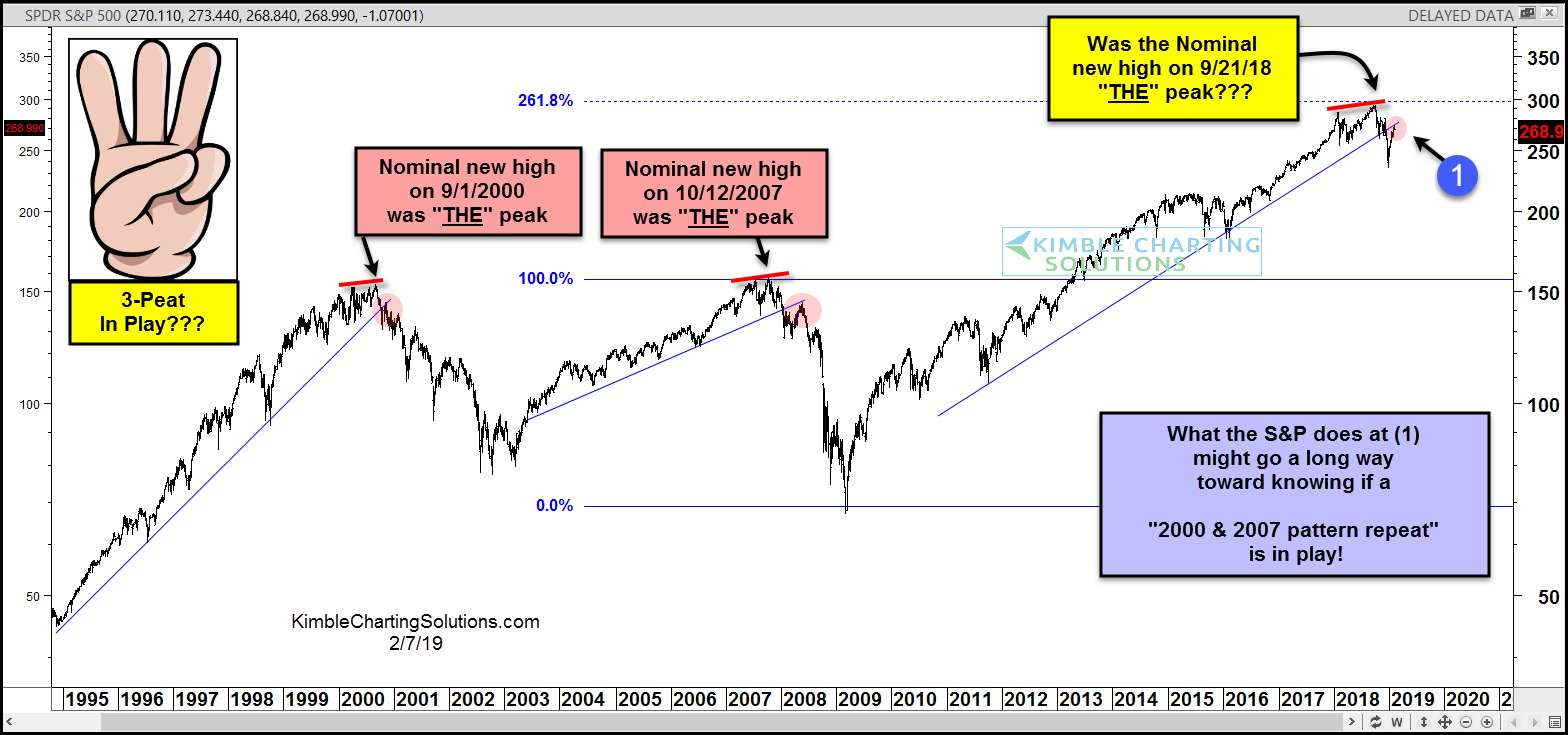
Looking at a long-term S&P 500 chart (below), we can see that the 2000 and 2007 highs are very similar to the 2018 highs. Each market top occurs around the same time period (September/October) and each top is formed after producing a nominal new high.
In each case, the longer-term trend is broken and retested – note the 2000 and 2007 market tops saw retests that failed. The verdict is out on the 2019 retest (1).
While there is no proof that a 3-peat is currently in play, what the S&P 500 does at (1) will go a long way in helping us understand if we are working our way out of a corrective period, or if we are in a bear market. Stay tuned!
S&P 500 Long-Term Chart – 3-Peat In Play?
Note that KimbleCharting is offering a 2 week Free trial to See It Market readers. Just send me an email to services@kimblechartingsolutions.com for details to get set up.
Twitter: @KimbleCharting
Any opinions expressed herein are solely those of the author, and do not in any way represent the views or opinions of any other person or entity.


 Flirting With Critical Support… Again")