Earnings Season really heats up this week.
Several large cap industry leaders report earnings across key sectors.
Today we discuss the most important names reporting this week.
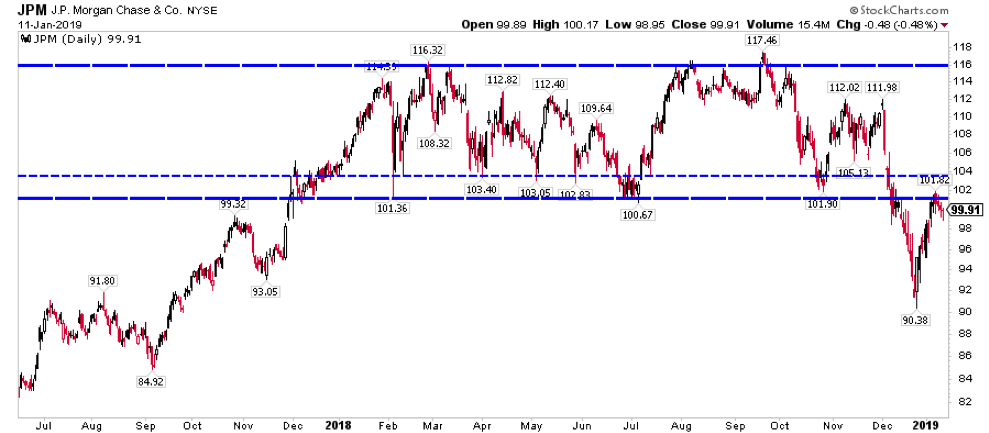
Many financials are reporting this week. Tuesday Morning J.P. Morgan (NYSE: JPM) reports.
Options are pricing in a 3.6% move while price is testing a long time pivot zone from below. Is this a giant double top? 112, 102 and 92 are levels to watch.
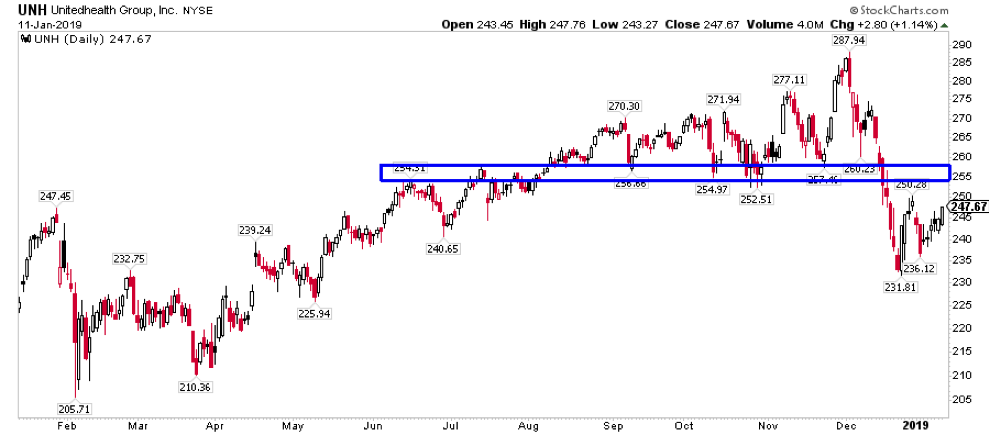
United Health (NYSE: UNH) also reports earnings Tuesday morning. Option straddles are pricing in Momentum is firmly bearish at this point. There is heavy support around the spring 2018 lows 205-210ish. Also note the key area above in the mid 250’s.
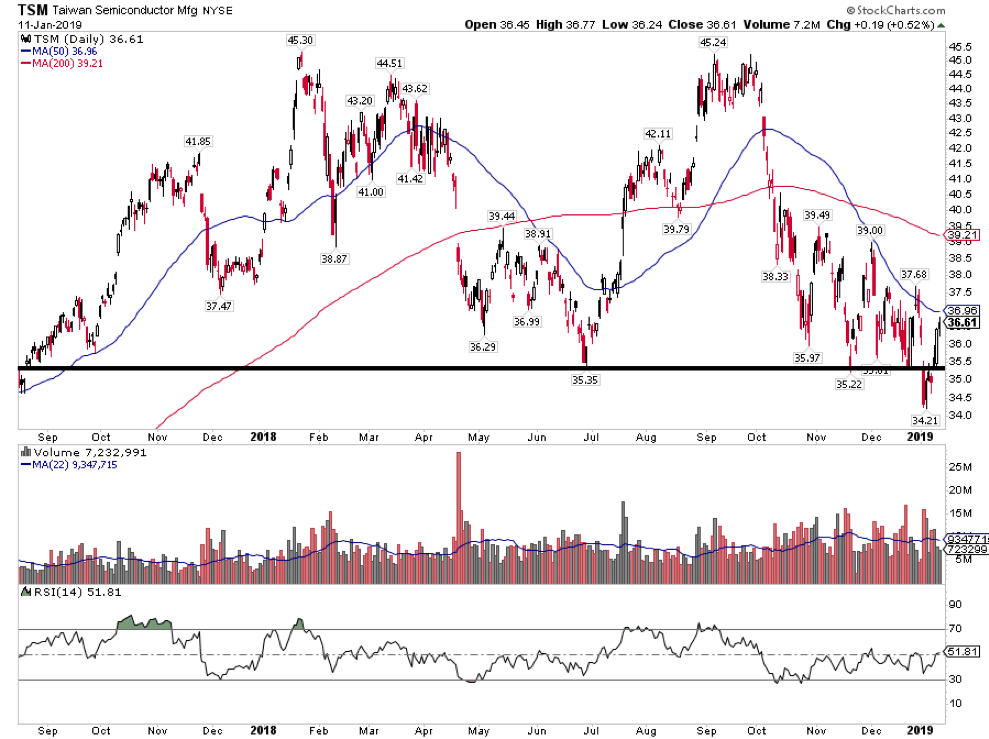
Thursday Morning, the world’s third largest semiconductor, Taiwan Semi (NYSE: TSM) reports earnings.
Shares recently broke below and recaptured 2018 support at 35. A move higher reinforces this range and a push push above 40 suggests the top of the range around 45 is in play. A push below 34 reinforces the strength of the downtrend we’ve seen.
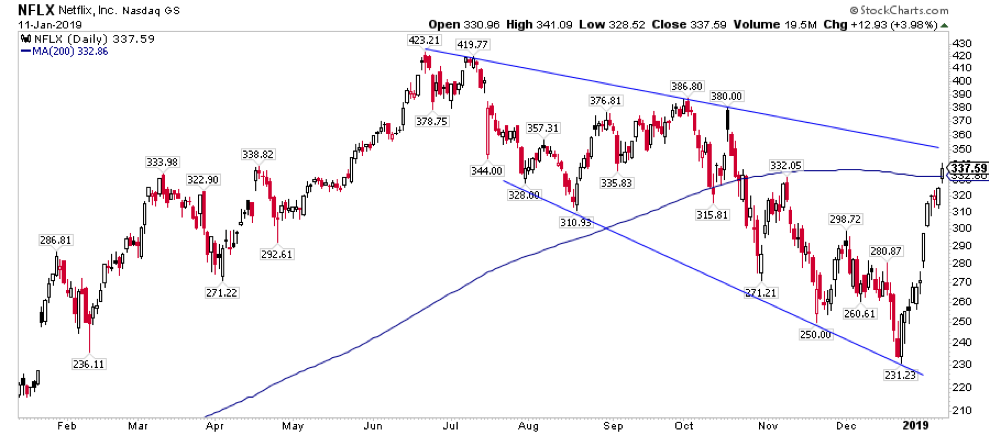
Netflix (NASDAQ: NFLX) reports earnings Thursday Night.
The stock has rallied 45% off the lows and is approaching trend resistance from last summer after declining 45%. 375-380 is a major resistance area to watch above while the 330-335 area is also worth noting. The broadening nature of price action speaks volumes. The stock wants to move, it just doesn’t know where as option straddles are implying a 10% earnings move.
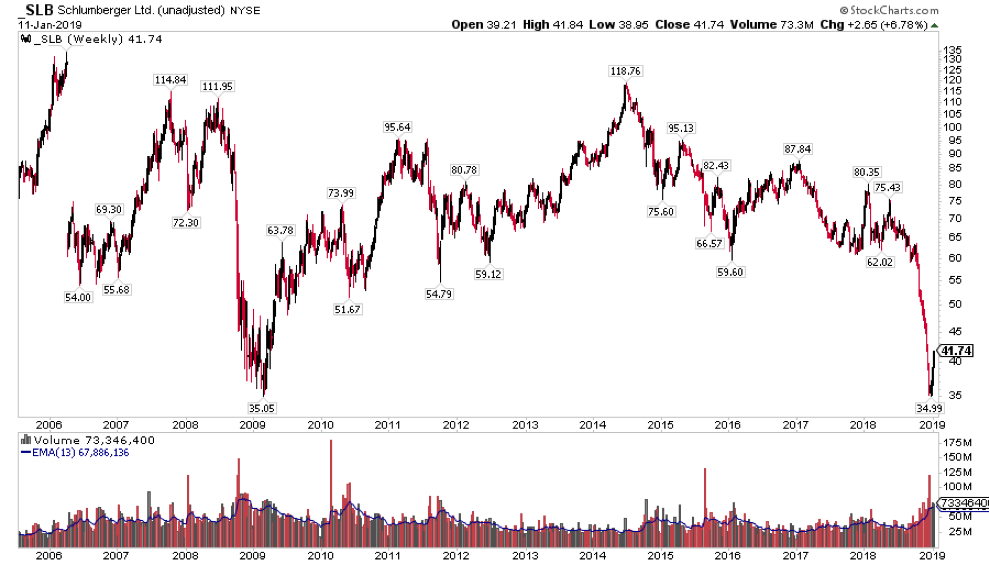
Schlumberger (NYSE: SLB) reports earnings on Friday Morning.
The company makes up 20% of the oil services industry ETF OIH. As you can see SLB has tested the 2009 low area and could be trading between 35 and 60ish for the foreseeable future.
Thanks for reading. Trade ‘em well!
Twitter: @ATMcharts
Any opinions expressed herein are solely those of the author and do not in any way represent the views or opinions of any other person or entity.

 Set For Revival?")


 Set For Revival?")