The equity markets pressed higher again today, following gains last week.
All the important stock market indices scored gains, with the S&P 500 Index (NYSEARCA: SPY) now within striking distance of the January high at 2872.
Stocks are being bolstered by strong economic fundamentals that have driven earnings above elevated expectations. Friday’s July Employment Report showed the economy added 157,000 jobs and the unemployment rate falling to 3.9% from 4.0%.
Over the past three months job gains have averaged 224,000 and wages have increased gradually, pointing to a healthy labor market and economy. If the economy continues to grow moderately we expect the Federal Reserve will continue on its path of quarterly increases in short-term interest rates.
While corporate earnings remain strong, there continues to be investor concern over trade, monetary policy and the mid-term elections.
Historically, according to Ned Davis Research, the period leading up to a mid-term election has often led to double-digit pullbacks in the stock market.
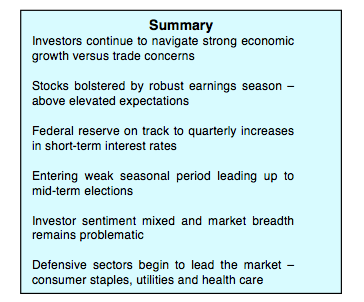
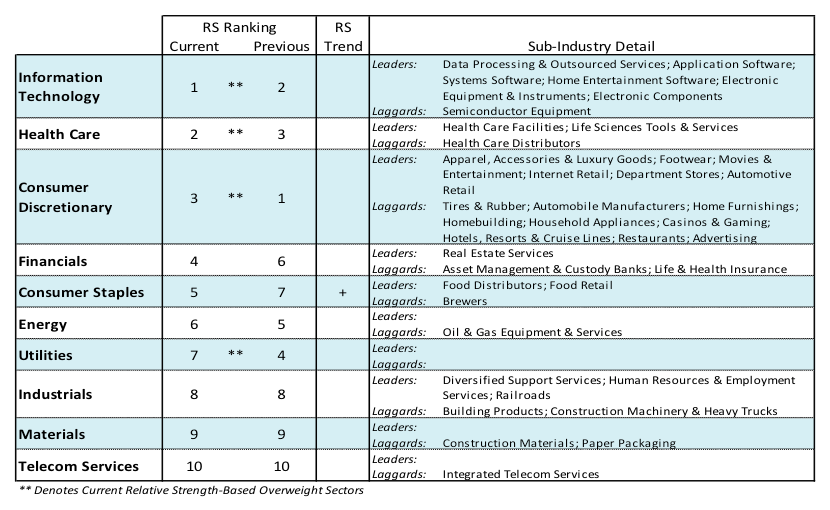
The good news is that after the election, stocks have often gone on to make higher highs. Despite all the hype surrounding the high-tech sector, last week’s gains in the S&P 500 Index were supported exclusively by defensive sectors. The charge was led by the consumer staples, utilities and health care sectors that all gained more than 1.00% for the week. We continue to advise diversifying into these defensive areas of the market.
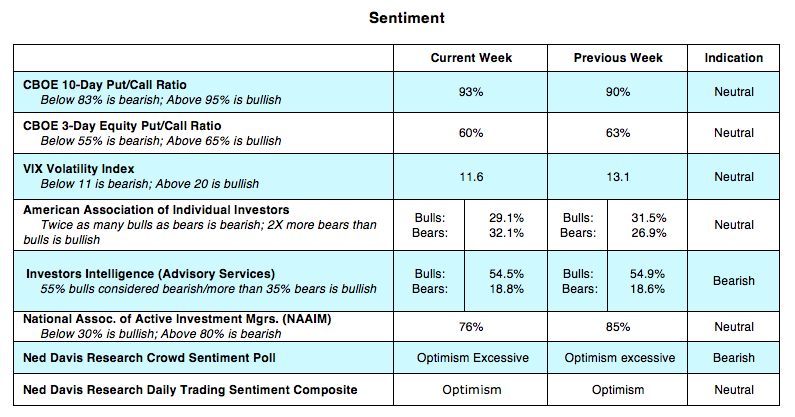
The S&P 500 Index has risen for five weeks in a row placing the market in an overbought condition. Investor sentiment is considered neutral. The latest survey from the American Association of Individual Investors (AAII) show more bears than bulls while the data from Investors Intelligence show more than twice as many bulls than bears. The widely followed Ned Davis Daily Trading Sentiment Composite has moved from excessive optimism to neutral.
The flow of funds data also indicates a more cautious approach by investors. According to Morningstar, more than $20 billion has been pulled from stock mutual funds and ETFs and the trend continued in July. This could also be a function of interest rates as the yield on Treasury bills now exceeds the return from dividends on the S&P 500. Seasonal trends are negative for stocks leading up to the mid-term elections but especially for small-cap stocks. The average draw-down for small-caps in a mid-term election year according to Ned Davis Research is 17%.
While seasonal trends play a modest role in technical analysis, there is some evidence that this pattern is beginning to unfold as small-cap stocks have declined in relative strength versus large-cap stocks in late July and early August. Additionally, market breadth remains problematic. Despite the gains in the averages last week, fewer stocks hit new 52-week highs and an increasing number of issues reached new lows for the year. Overall, the technical indicators argue on the side of caution.
Twitter: @WillieDelwiche
Any opinions expressed herein are solely those of the author, and do not in any way represent the views or opinions of any other person or entity.


: Where’s the Deflation in This?")


: Where’s the Deflation in This?")
