With the stock market continuing to exhibit choppy trading dynamics, we look at some of the interesting themes and relationships beyond the index level to give us an idea if the next major trend will be a continuation higher or a reversal lower.
Let’s dig right in and look at 6 interesting market themes and relationships…
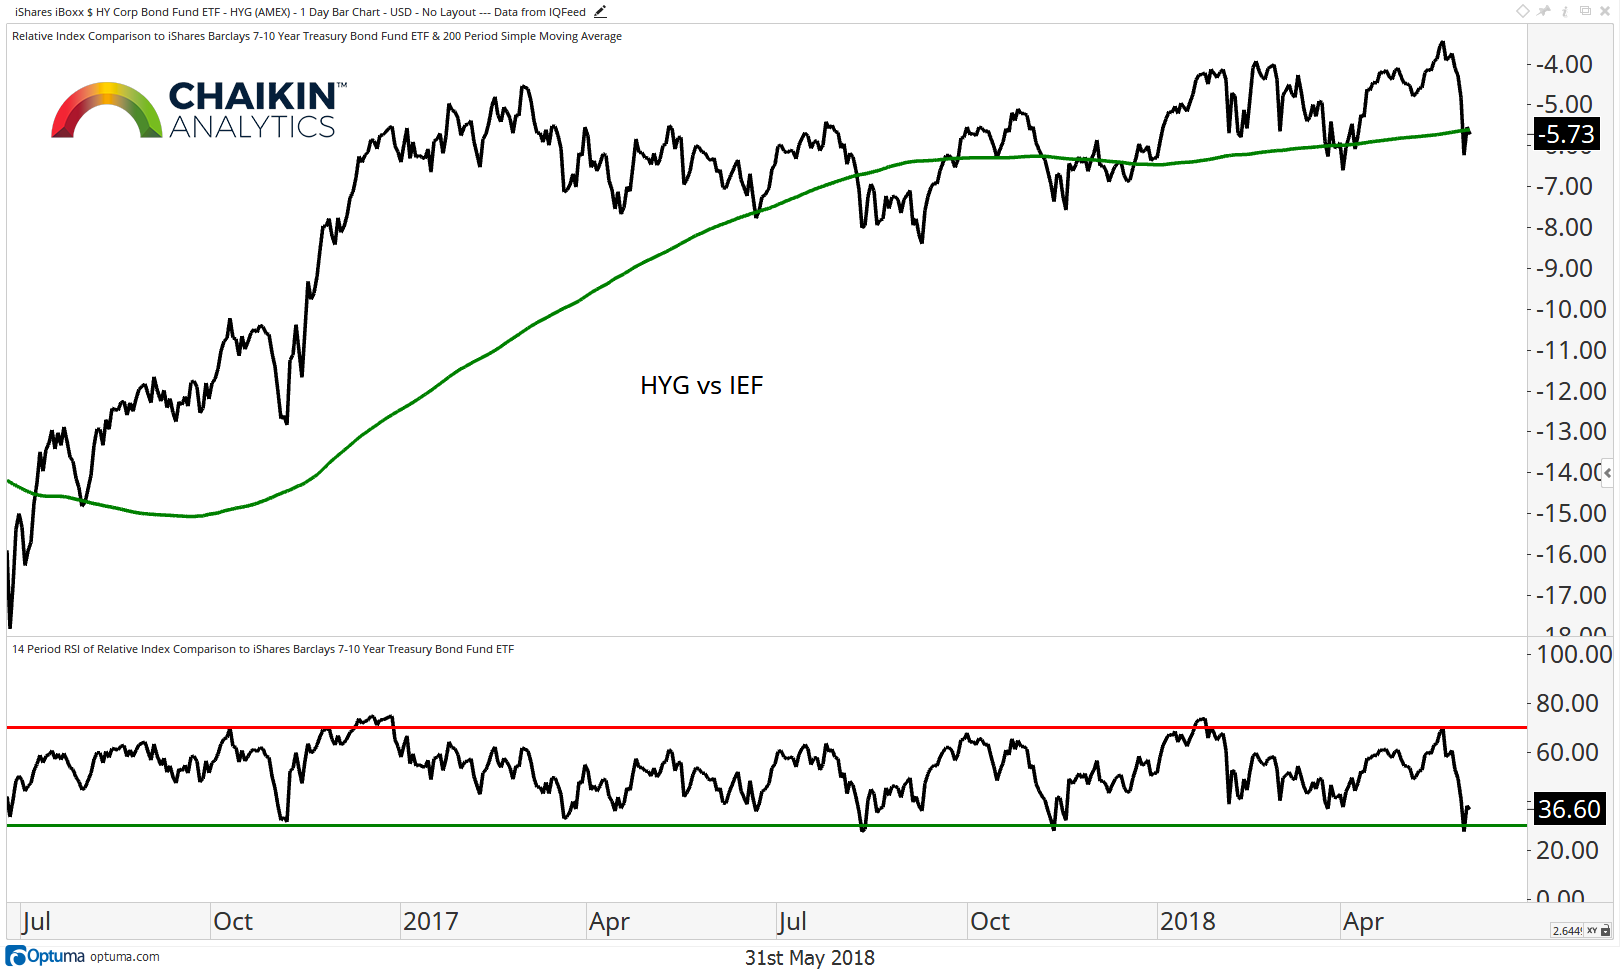
High Yield to Treasuries Ratio
The performance of high yield bonds relative to treasury bonds can be a barometer for risk appetite in the market. Here we have the ratio of HYG (high yield) to IEF (intermediate-term treasuries). When this ratio is on the rise, it means that high yield is outperforming and investors are showing a willingness to take on risk.
The ratio has pulled back following last week’s breakout and the RSI is now closer to oversold. Further weakness in this ratio should be watched closely.
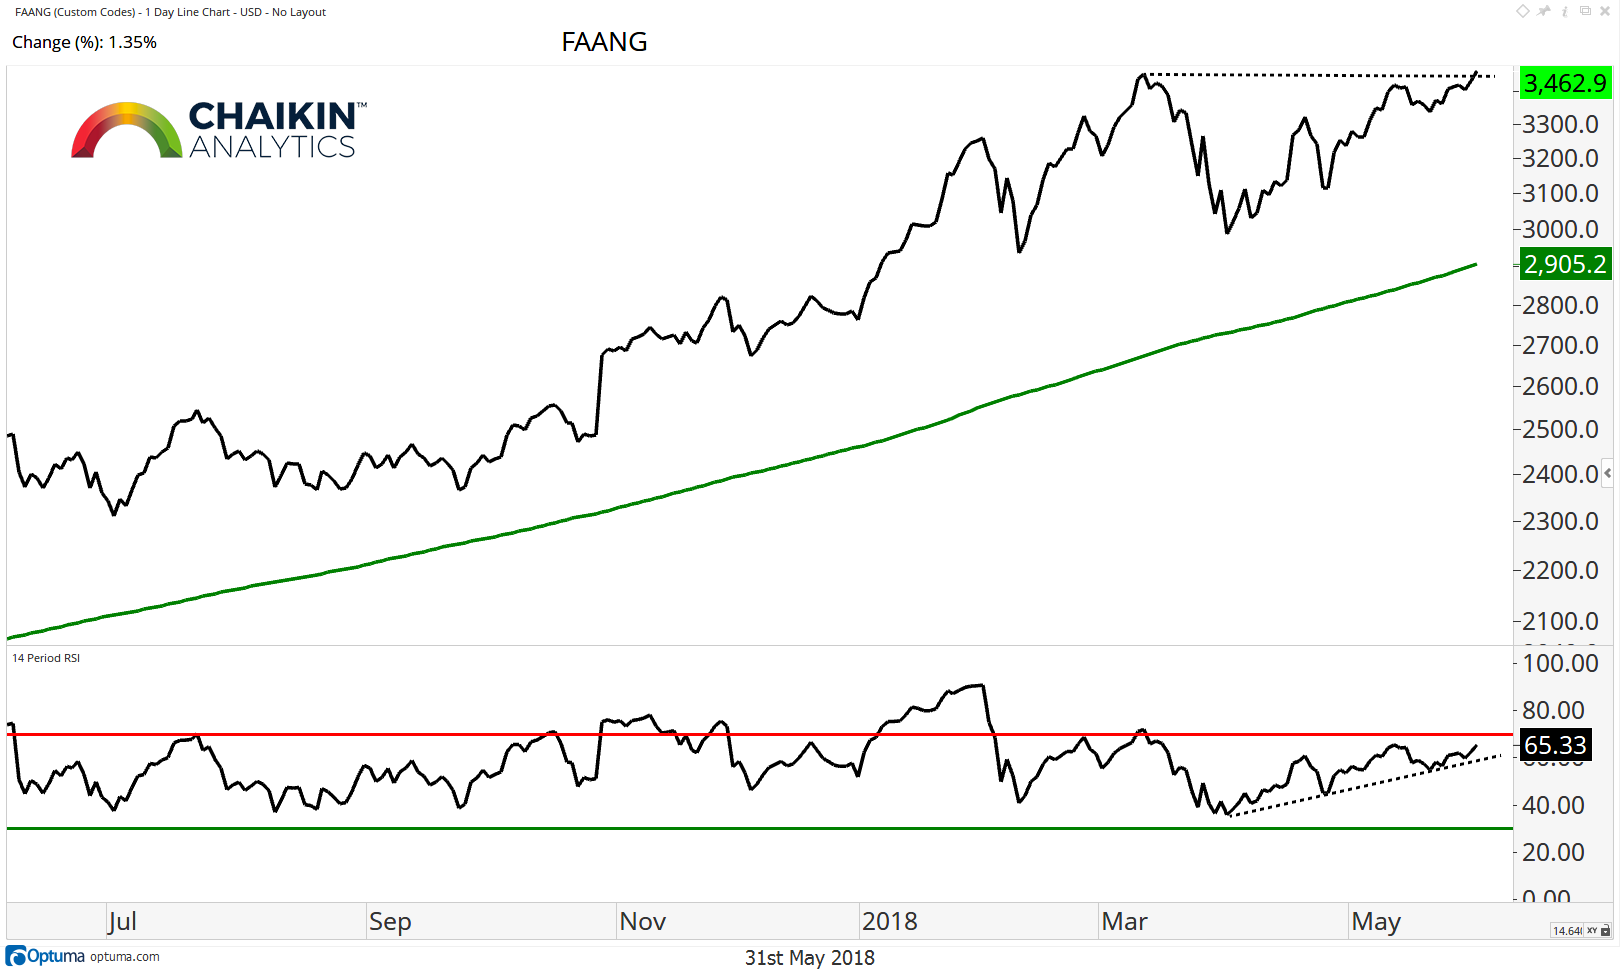
FAANG Stocks
The FAANG (FB, AMZN, AAPL NFLX & GOOGL) stocks are the market generals and their performance is likely to have a big impact on the overall direction it takes. The group (based on a custom index which we built) has moved up and out of the consolidation that has been in place since March. Momentum has shifted to bullish ranges.
The FAANG index has made a new high which could have bullish implications for the broader stock market.
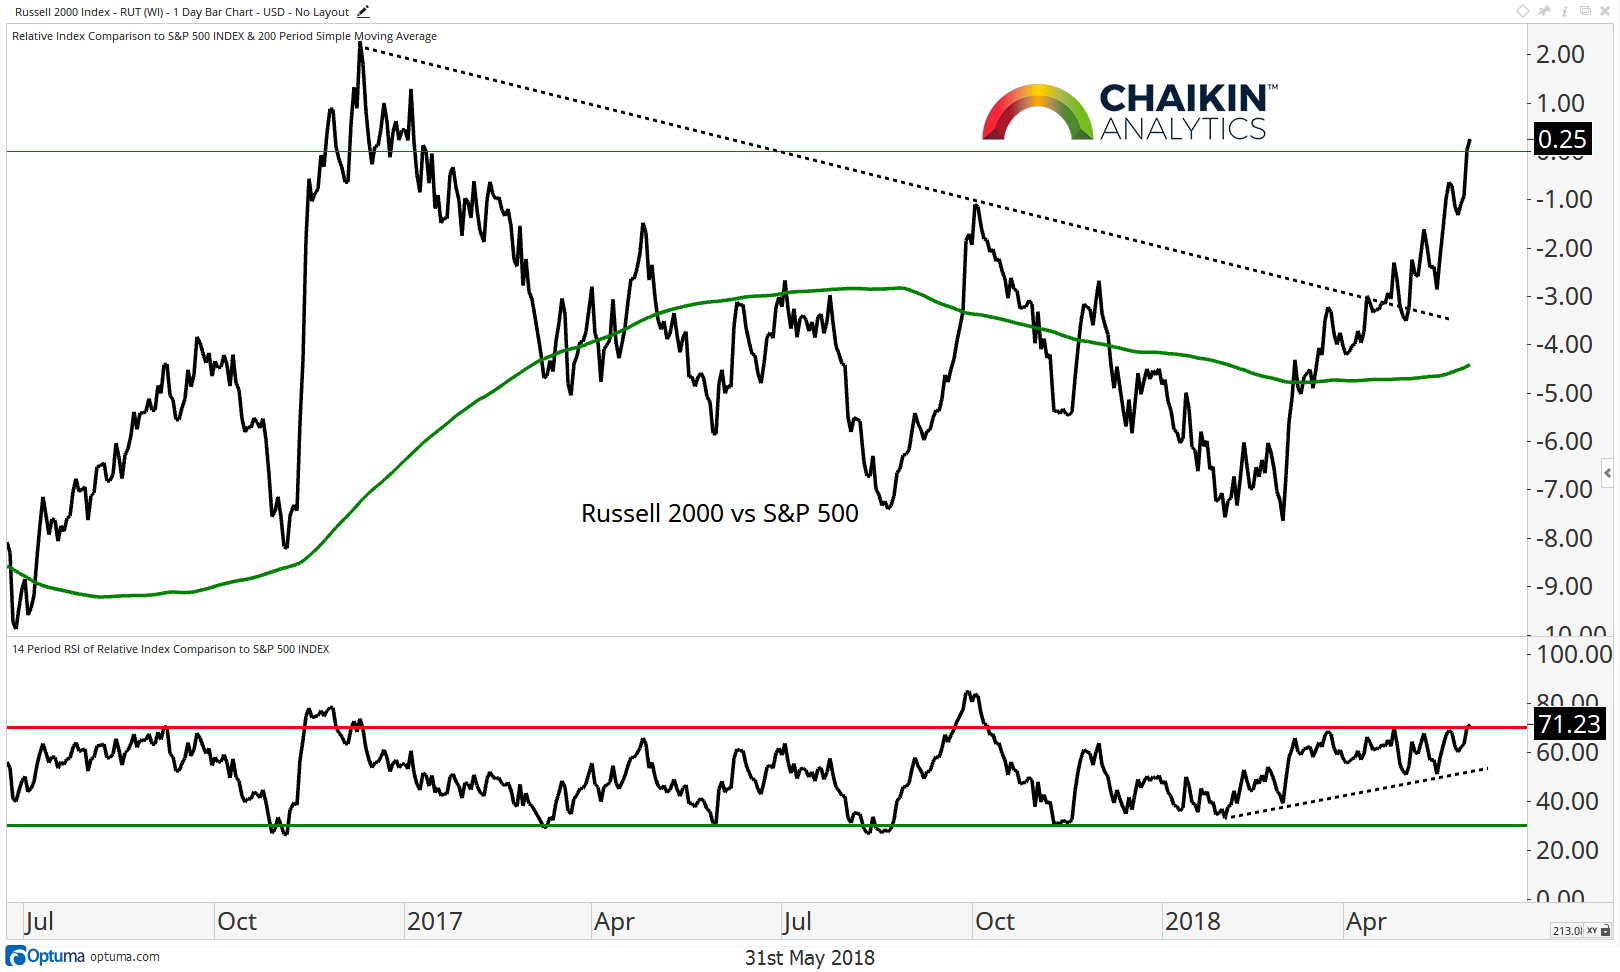
Small Cap’s Relative Performance
This is a theme we focus on because it highlights market breadth as well as risk appetite. If the small caps are outperforming, that is a bullish indicator for the market because small stocks are viewed as more risky than large and it shows broader participation at the stock level.
Here is the Russell 2000 relative to the S&P 500 and we can see that the small caps have broken a downtrend from December 2016 and the RSI has shifted to bullish ranges.
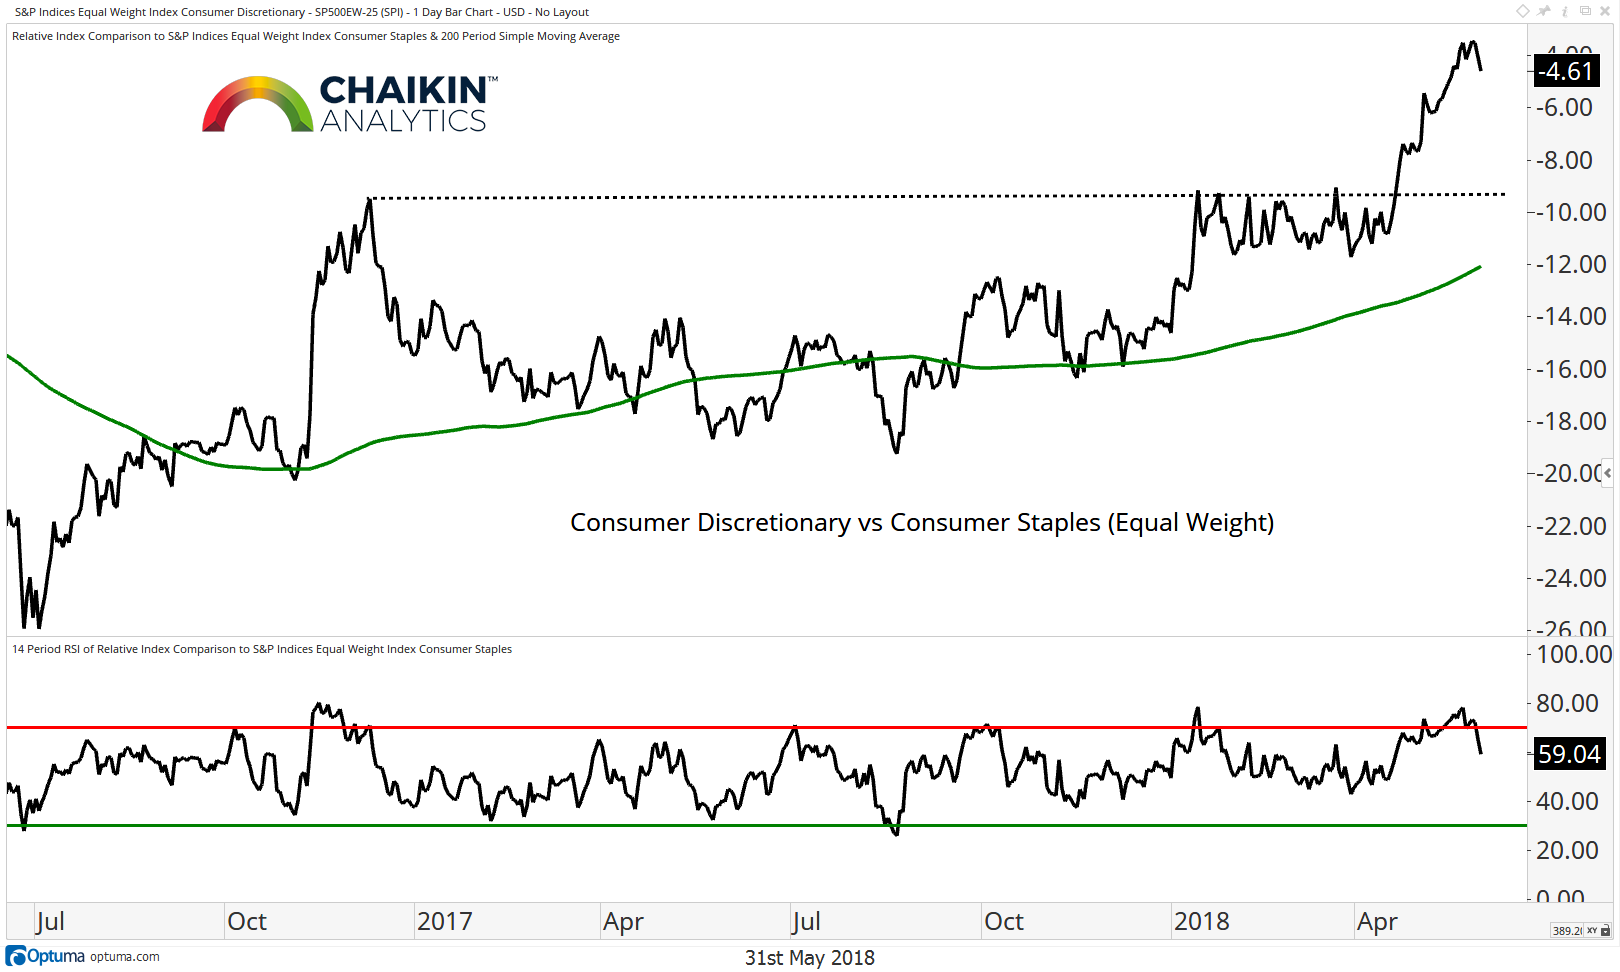
The Consumer Discretionary to Consumer Staples Ratio (Equal Weight)
Discretionary continues to lead Staples (on an equal weight basis) following a break to new highs. The breakout is confirmed by momentum as the RSI has also made a local high. Last week we highlighted that the RSI was overbought and a pull back was likely and that appears to be taking place but the trend remains firmly higher.
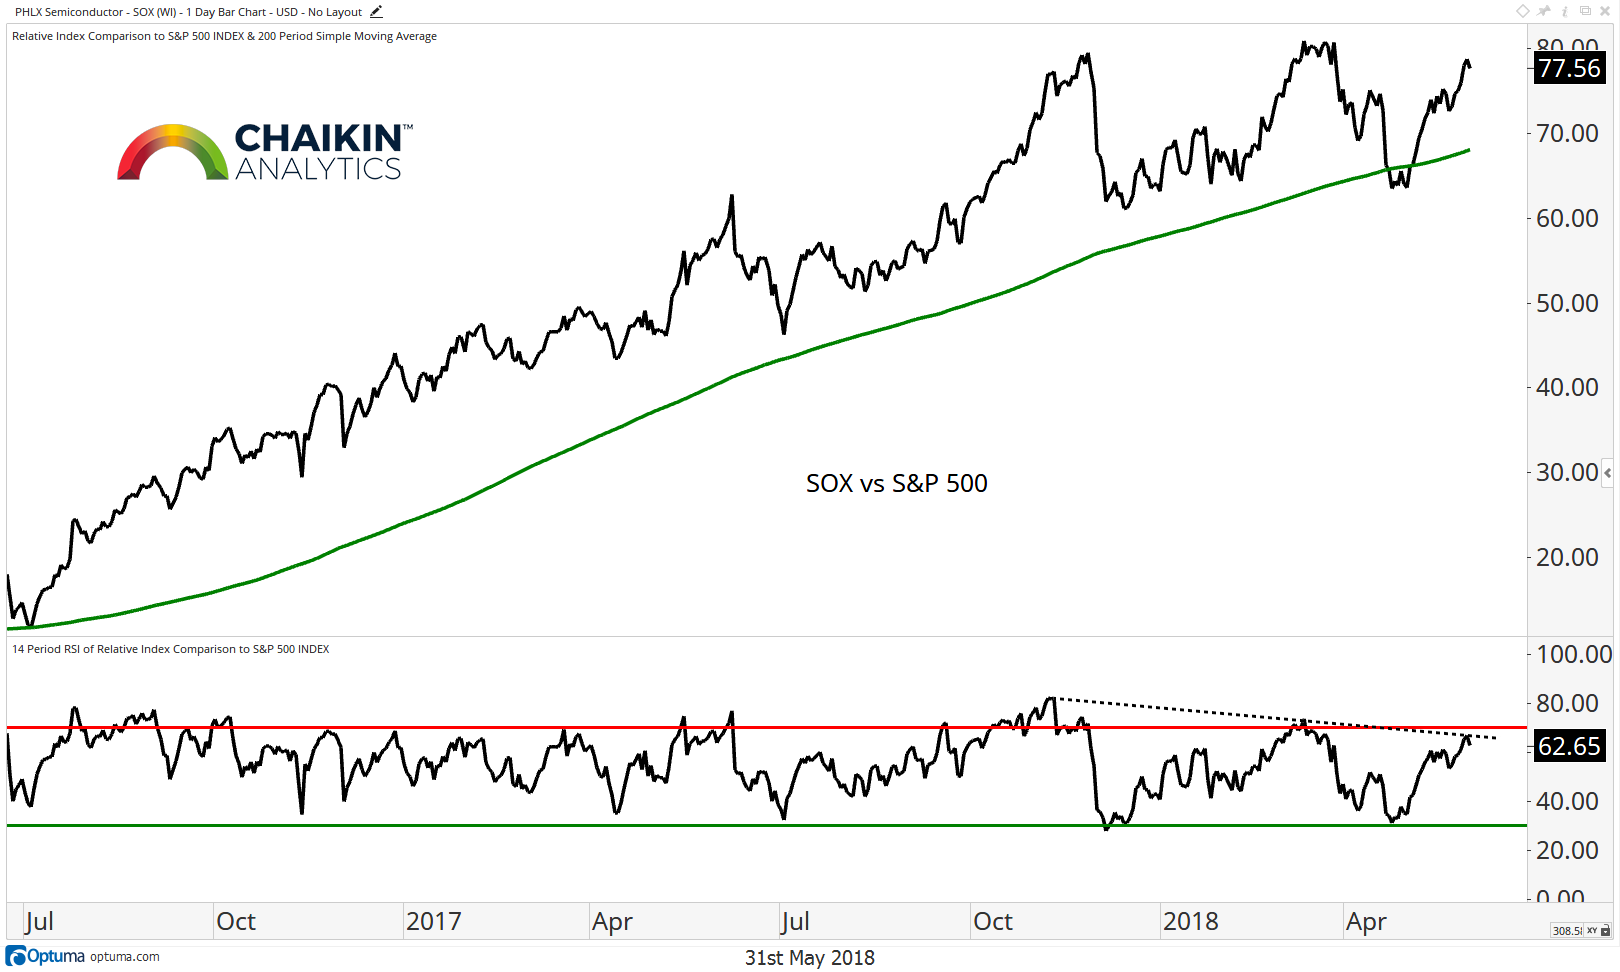
Semiconductors Relative to the S&P 500
The semiconductors are moving higher (relative to the S&P 500) after a successful test and hold of the 200-day moving average. The RSI has made a series of lower highs decreasing the odds of a breakout in the near-term. If this ratio can break to new highs, that would signal that the S&P 500 is likely to do the same.
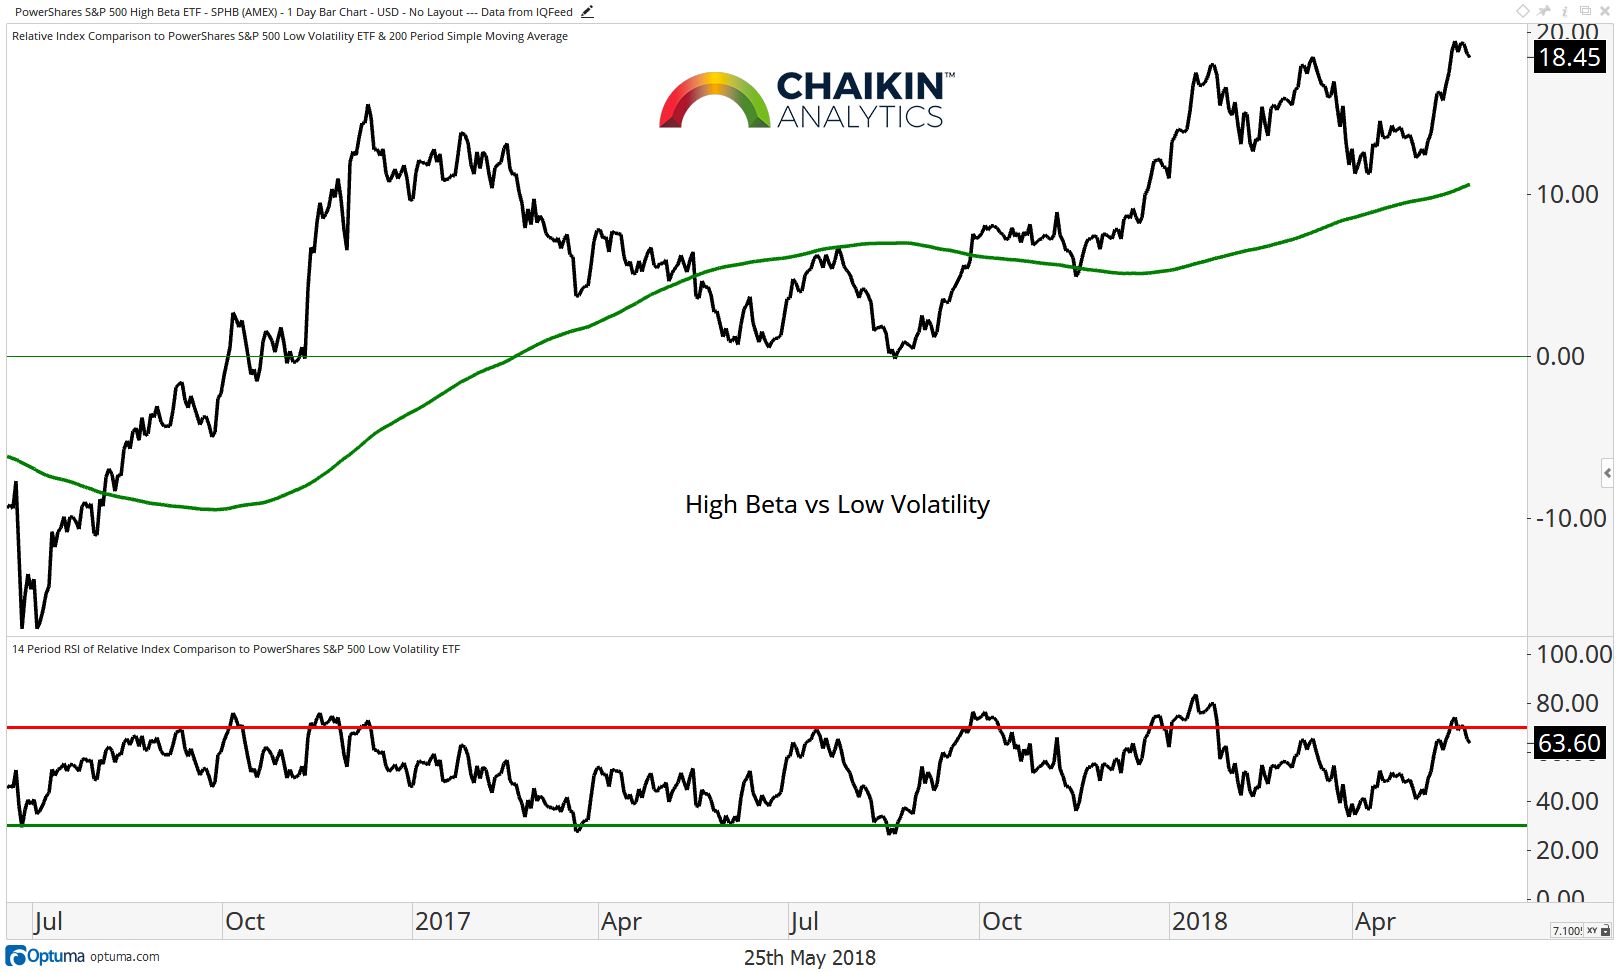
High Beta Relative to Low Volatility
Another way to measure the risk appetite of investors is to look at the performance of the PowerShares S&P 500 High Beta ETF (SPHB) relative to the PowerShares S&P 500 Low Volatility ETF (SPLV).
We can see that the ratio recently made a break to new highs in a move that was confirmed by momentum as the RSI also registered a local high. Investor’s willingness to own high beta stocks over low volatility stocks is a bullish indicator for the market.
You can gain more insights into our methodology and stock picking over at Chaikin Analytics. Thanks for reading.
Twitter: @DanRusso_CMT
Author may have a position in mentioned securities at the time of publication. Any opinions expressed herein are solely those of the author, and do not in any way represent the views or opinions of any other person or entity.

: Where’s the Deflation in This?")


: Where’s the Deflation in This?")
