Broad Stock Market Futures Outlook for June 4, 2018
The charts are showing breaches of prior resistance across the stock indices, but under a continued technical divergence. Allow levels to test and fail if you are looking for shorts… or to test and hold if you are looking for longs.
Pullbacks remain buying areas so be patient if choosing your trading directions.
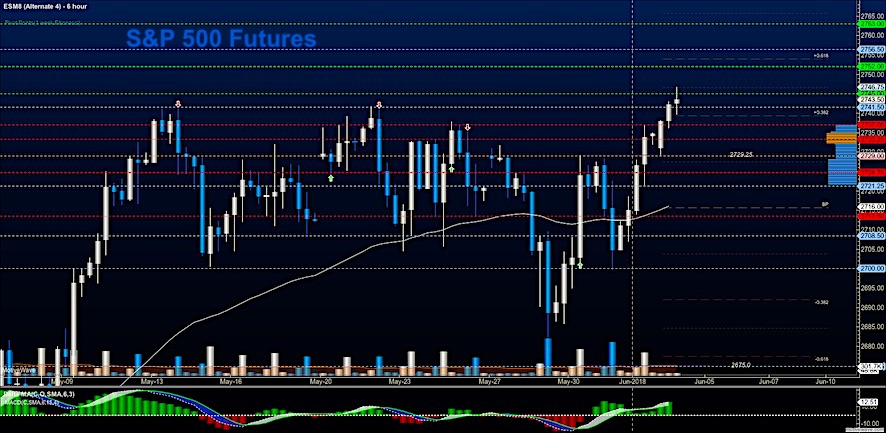
S&P 500 Futures
Traders are stalled at new resistance levels in the early morning but bullish pressure suggests that fades will become buying opportunities in the current formation. Use caution chasing trades today. The bullets below represent the likely shift of trading momentum at the successful or failed retests at the levels noted.
- Buying pressure intraday will likely strengthen with a bullish retest of 2745.50
- Selling pressure intraday will likely strengthen with a bearish retest of 2734.5
- Resistance sits near 2745.5 to 2751.75, with 2756.75 and 2763.75 above that.
- Support sits between 2739.75 and 2734.5, with 2729.5 and 2719.5
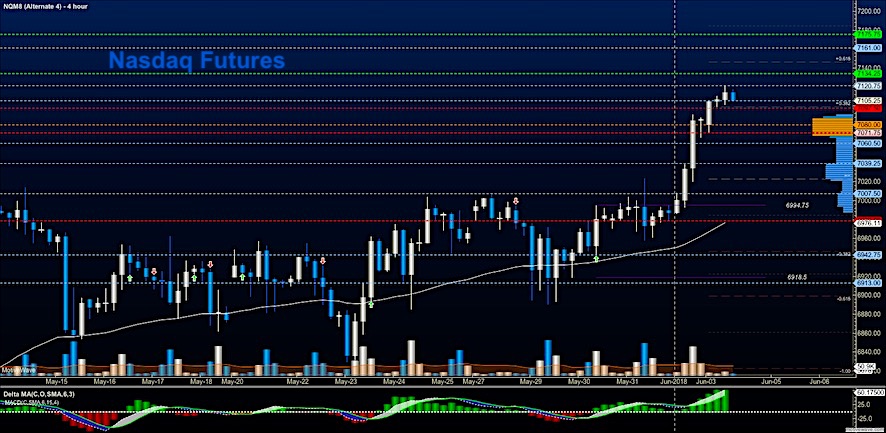
NASDAQ Futures
Stronger rebound continues to show in this chart for the fourth trading day with our new support level near 7101. Momentum is still mixed here with higher resistance showing near 7118. Formations remain generally bullish but divergent. Chasing breakouts are ill-advised unless a scalping event is underway for you. The bullets below represent the likely shift of trading momentum at the successful or failed retests at the levels noted.
- Buying pressure intraday will likely strengthen with a bullish retest of 7119.75
- Selling pressure intraday will likely strengthen with a bearish retest of 7084.5
- Resistance sits near 7116.75 to 7133.25 with 7046.25 and 7161.5 above that.
- Support sits between 7096.5 and 7084.5, with 7071.75 and 7018.75 below that.
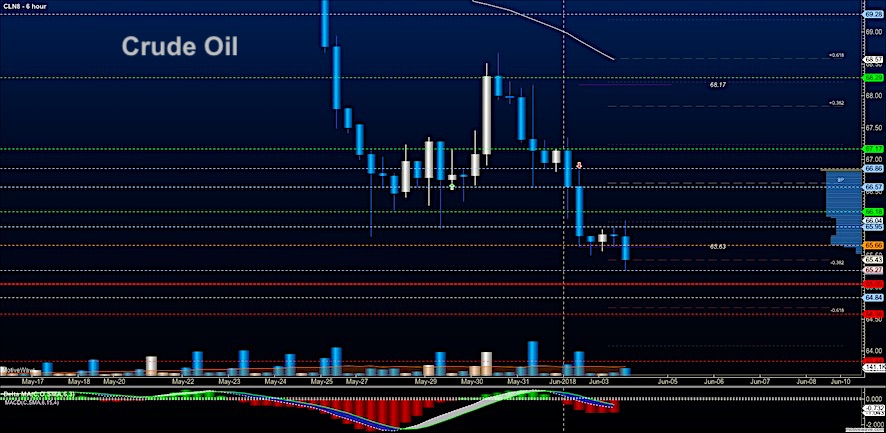
WTI Crude Oil
Downward pressure to this chart continues as we test and fail the target mentioned last week of 65.57. Dips have been deep and we are extended so traders are offloading contracts. I do expect us to stall here nearby and begin to chop sideways. It’s another ‘do or die’ for buyers here near these regions, so expect a fight. The bullets below represent the likely shift of trading momentum at the successful or failed retests at the levels noted.
- Buying pressure intraday will likely strengthen with a bullish retest of 66.07
- Selling pressure intraday will strengthen with a bearish retest of 65.20
- Resistance sits near 65.97 to 66.18, with 66.57 and 67.17 above that.
- Support holds near 65.32 to 65.11, with 64.87 and 64.58 below that.
You can learn more about trading and our memberships HERE.
Twitter: @AnneMarieTrades
The author trades stock market futures every day and may have a position in mentioned securities at the time of publication. Any opinions expressed herein are solely those of the author, and do not in any way represent the views or opinions of any other person or entity.

 Vying For Stock Market Leadership Role")
 Current Price Analysis and Future Considerations")

 Current Price Analysis and Future Considerations")
 Vying For Stock Market Leadership Role")
