Broad Stock Market Futures Outlook for April 11, 2018
With the failure of the S&P 500 futures to hold a key price region around 2635, the charts are still range bound and likely to fail to continue in either direction. The failure to hold higher lows or the failure to hold higher highs intraday will confirm this.
That said, traders can use intraday motion to move from support to resistance and vice versa across the stock market indices today.
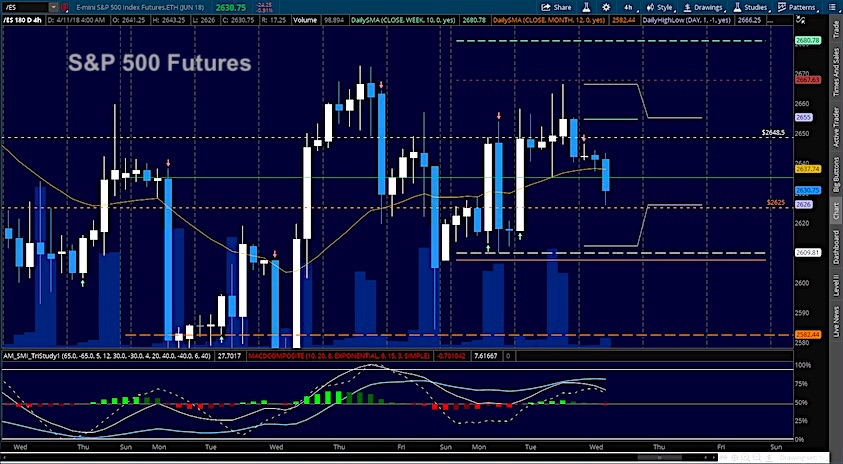
S&P 500 Futures
Support is lower near another familiar area – 2625 – as we faded from the evening highs. We now have negative intraday drift. Sellers will have much more control below 2625 – this will be the level to test and hold for bullish action – or test and fail for bearish action today. The bullets below represent the likely shift of trading momentum at the positive or failed retests at the levels noted.
- Buying pressure intraday will likely strengthen with a bullish retest of 2637.75
- Selling pressure intraday will likely strengthen with a bearish retest of 2625.5
- Resistance sits near 2647.75 to 2651.5, with 2666.25 and 2674.75 above that.
- Support sits between 2626 and 2621.5, with 2613.5 and 2597.50
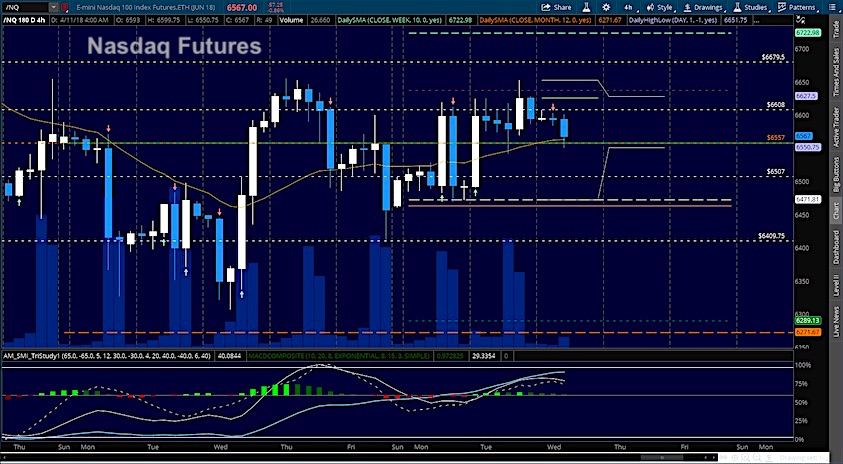
NASDAQ Futures
Steeper upside momentum telegraphed the breach of lower resistance and traders were able to take this chart into yesterday’s third target of 6652 before backing off. The line in the sand today sits near 6557 and so far, buyers are forcing us above this range. As yesterday, pullbacks are buying zones as long as we hold above 6548. The chart is quite messy between 6557 and 6614 – a range a little wider than yesterday’s regions. The bullets below represent the likely shift of intraday trading momentum at the positive or failed tests at the levels noted.
- Buying pressure intraday will likely strengthen with a bullish retest of 6582.75
- Selling pressure intraday will likely strengthen with a bearish retest of 6548
- Resistance sits near 6607.5 to 6626.5 with 6652.5 and 6727.25 above that.
- Support sits between 6550.5 and 6525.5, with 6505.25 and 6460.75 below that.
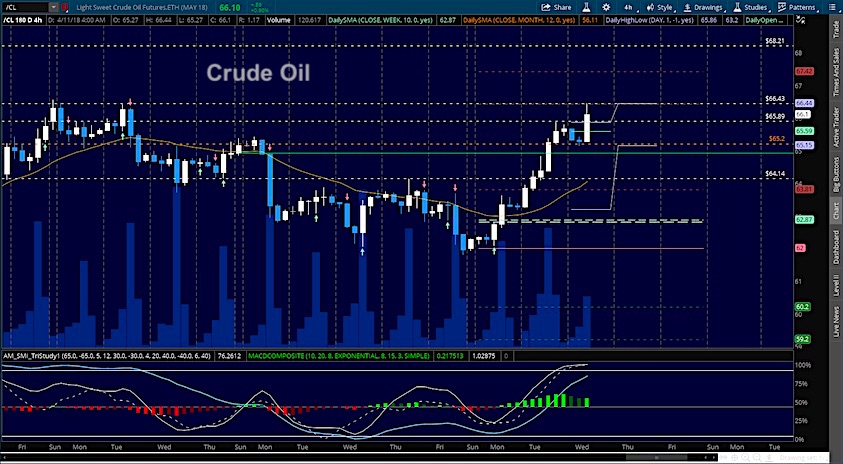
WTI Crude Oil
Higher lows and higher highs here as oil stretches into near the year’s high for the WTI. The EIA report today will be at 10:30 am ET today. Bullish pressure is present and pullbacks on the first pass will be buying zones but we are also potentially at the tipping point for the highs as they retest. Watch support as well as the failure to make new highs as caution signals for traders. The bullets below represent the likely shift of intraday trading momentum at the positive or failed tests at the levels noted.
- Buying pressure intraday will likely strengthen with a bullish retest of 66.15
- Selling pressure intraday will strengthen with a bearish retest of 65.59
- Resistance sits near 66.4 to 67.05, with 67.44 and 68.2 above that.
- Support holds near 65.89 to 65.2, with 64.8 and 64.14 below that.
Twitter: @AnneMarieTrades
The author trades stock market futures every day and may have a position in mentioned securities at the time of publication. Any opinions expressed herein are solely those of the author, and do not in any way represent the views or opinions of any other person or entity.


