Walmart’s online sales growth appears to be slipping and that has been a catalyst in sending the stock price lower.
But as I often say, gaps always get closed. And in this case, there’s one open just a bit further below.
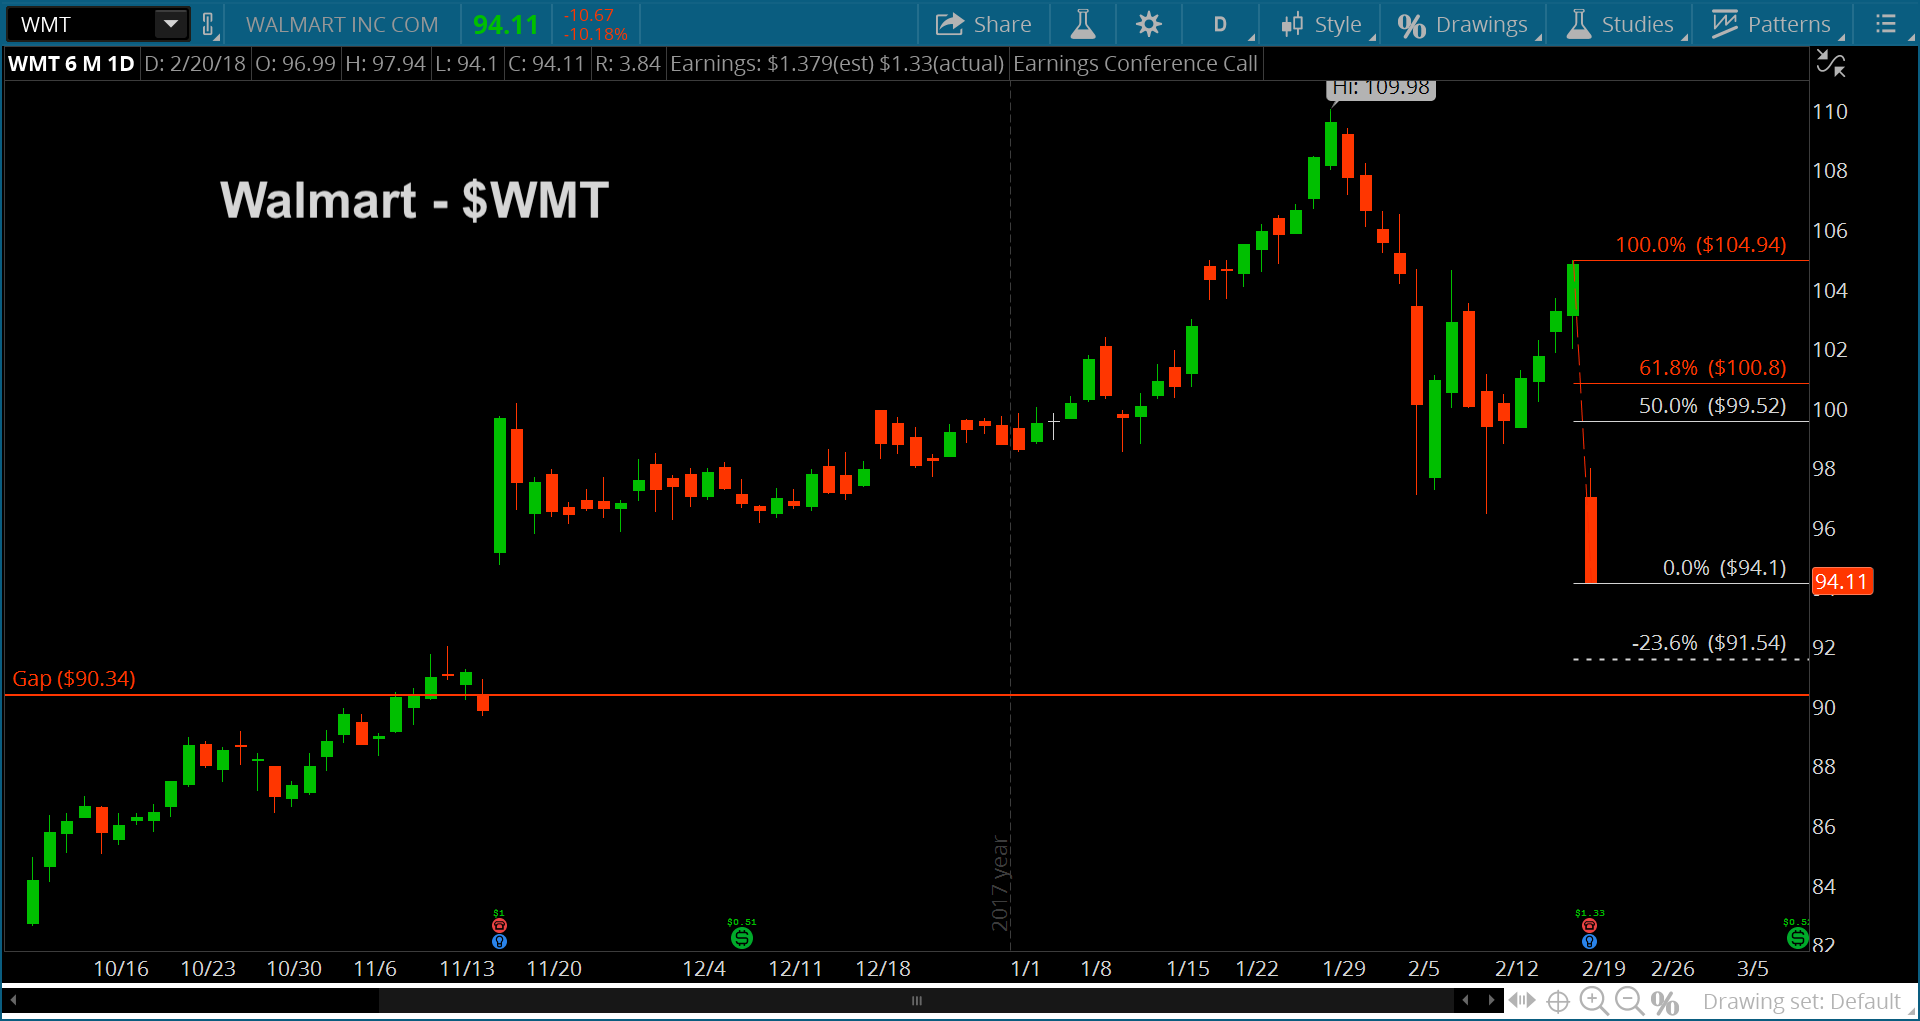
Let’s look at the chart below and discuss the current trading setup.
Walmart (WMT) has a current daily price target of 91.54. This comes to pass using my fibonacci swing targets.
Current price resistance sits between 99.52 – 100.8.
But there’s a big open gap at 90.34… and all gaps eventually get closed. Combining this with the lower “daily” target at 91.54 and its likely to see rallies sold in the days ahead until that price target is hit.
Walmart “Daily” Stock Chart
Note that you can get more of my trading insights and analysis at Bottom Line Trades. Thanks for reading and have a great week!
Twitter: @TheFibDoctor
No position in any of the mentioned securities at the time of publication. Any opinions expressed herein are solely those of the author, and do not in any way represent the views or opinions of any other person or entity.

: Showing Some Signs of Emerging Strength")
