IBM (NYSE:IBM) has been a stock on my radar for a long time. In fact, I wrote about IBM a few times right here on See It Market over the years.
Shares of IBM have been declining for months now but the tumble should be of little surprise… especially after the stock put in a lower high earlier this year.
For reference, here’s my past 2 updates:
- Why IBM’s Stock May Reverse Higher In 2015 (DEC 2014)
- IBM Stock Update: Is A Breakout Underway? (APR 2015)
Those were “trading” posts (i.e. short-term) from quite some time ago and a lot has happened since… but they do bear some relevance to how and why IBM has been in decline.
IBM’s stock price went right up into the price area shown roughly two years prior and smacked into stiff resistance (putting in a lower high). And the stock has been selling off ever since.
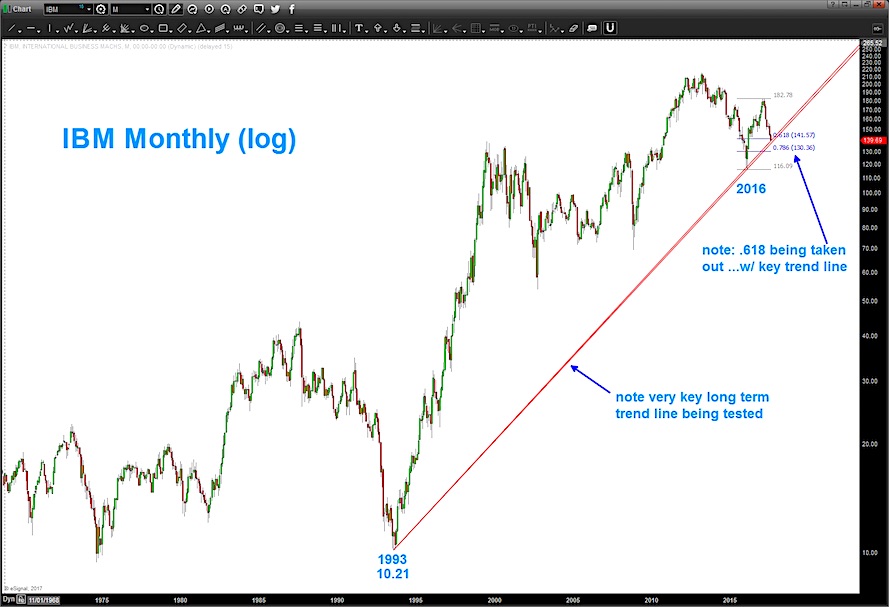
It’s important to take note that IBM is very close to breaking below a long term log trend line from 1993. This price area also corresponds to the .618 fibonacci retracement from the rally lows a couple of years ago. Pay attention here – this could start accelerating quickly if shares continue to see weakness and fall below the long term trend line. Bulls need to step up here.
Twitter: @BartsCharts
Author does not have a position in mentioned securities at the time of publication. Any opinions expressed herein are solely those of the author, and do not in any way represent the views or opinions of any other person or entity.
ALSO READ: Is Apple’s Stock (AAPL) Nearing A Major Top?


