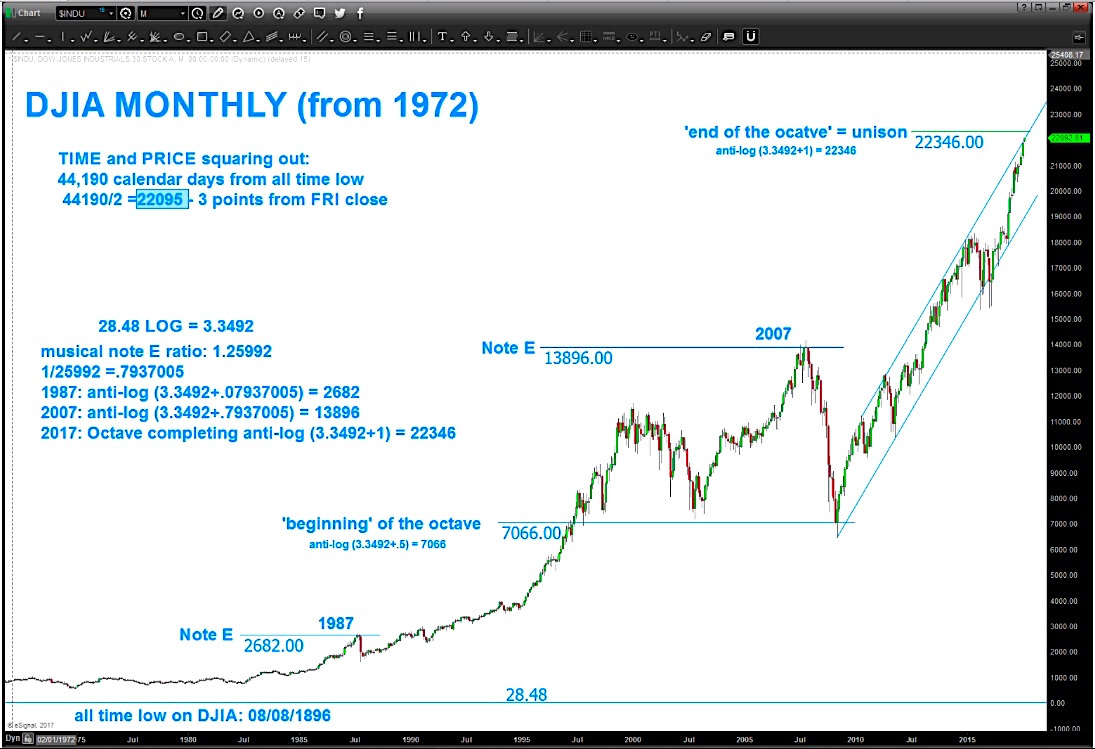
I am tracking a price target on the Dow Jones Industrials Average (INDEXDJX:.DJI) in and around 22,346.
So how did I come to that price target?
I believe that the market is both harmonic and vibratory. Over the course of the past several years, I have shown people how to use patterns to manage risk. Sometimes they are right and sometimes they aren’t… but they do offer us insights into the markets ebb and flow.
Below is an updated monthly bar chart of the Dow Industrials showing the approaching Octave price target. Does the market have to respect it? OF COURSE NOT! BUT the math doesn’t lie so I’ve been waiting to see what happens for a while. Come on you DJIA – just a little higher and let’s see what happens!
Also note the square out in TIME and PRICE that occurred Friday/Monday.
44190 calendar days since the all time low in 1896. 44190/2 = 22095. That’s within 25 points of Friday/Monday/Tuesday closing prices. Close enough? We’ll soon find out… It’s all probability folks.
Twitter: @BartsCharts
Author does not have a position in mentioned securities at the time of publication. Any opinions expressed herein are solely those of the author, and do not in any way represent the views or opinions of any other person or entity.
ALSO READ: Facebook’s Stock Is About To Head Lower


