Stock Market Futures Considerations For July 11, 2017
The S&P 500 (INDEXSP:.INX) bumped into overhead resistance yesterday and is now testing support. On the futures, 2420 to 2422 is first price support. See full trading levels for the S&P 500, Nasdaq, and Crude Oil below.
Check out today’s economic calendar with a full rundown of releases. And note that the charts below are from our premium service and shared exclusively with See It Market readers.
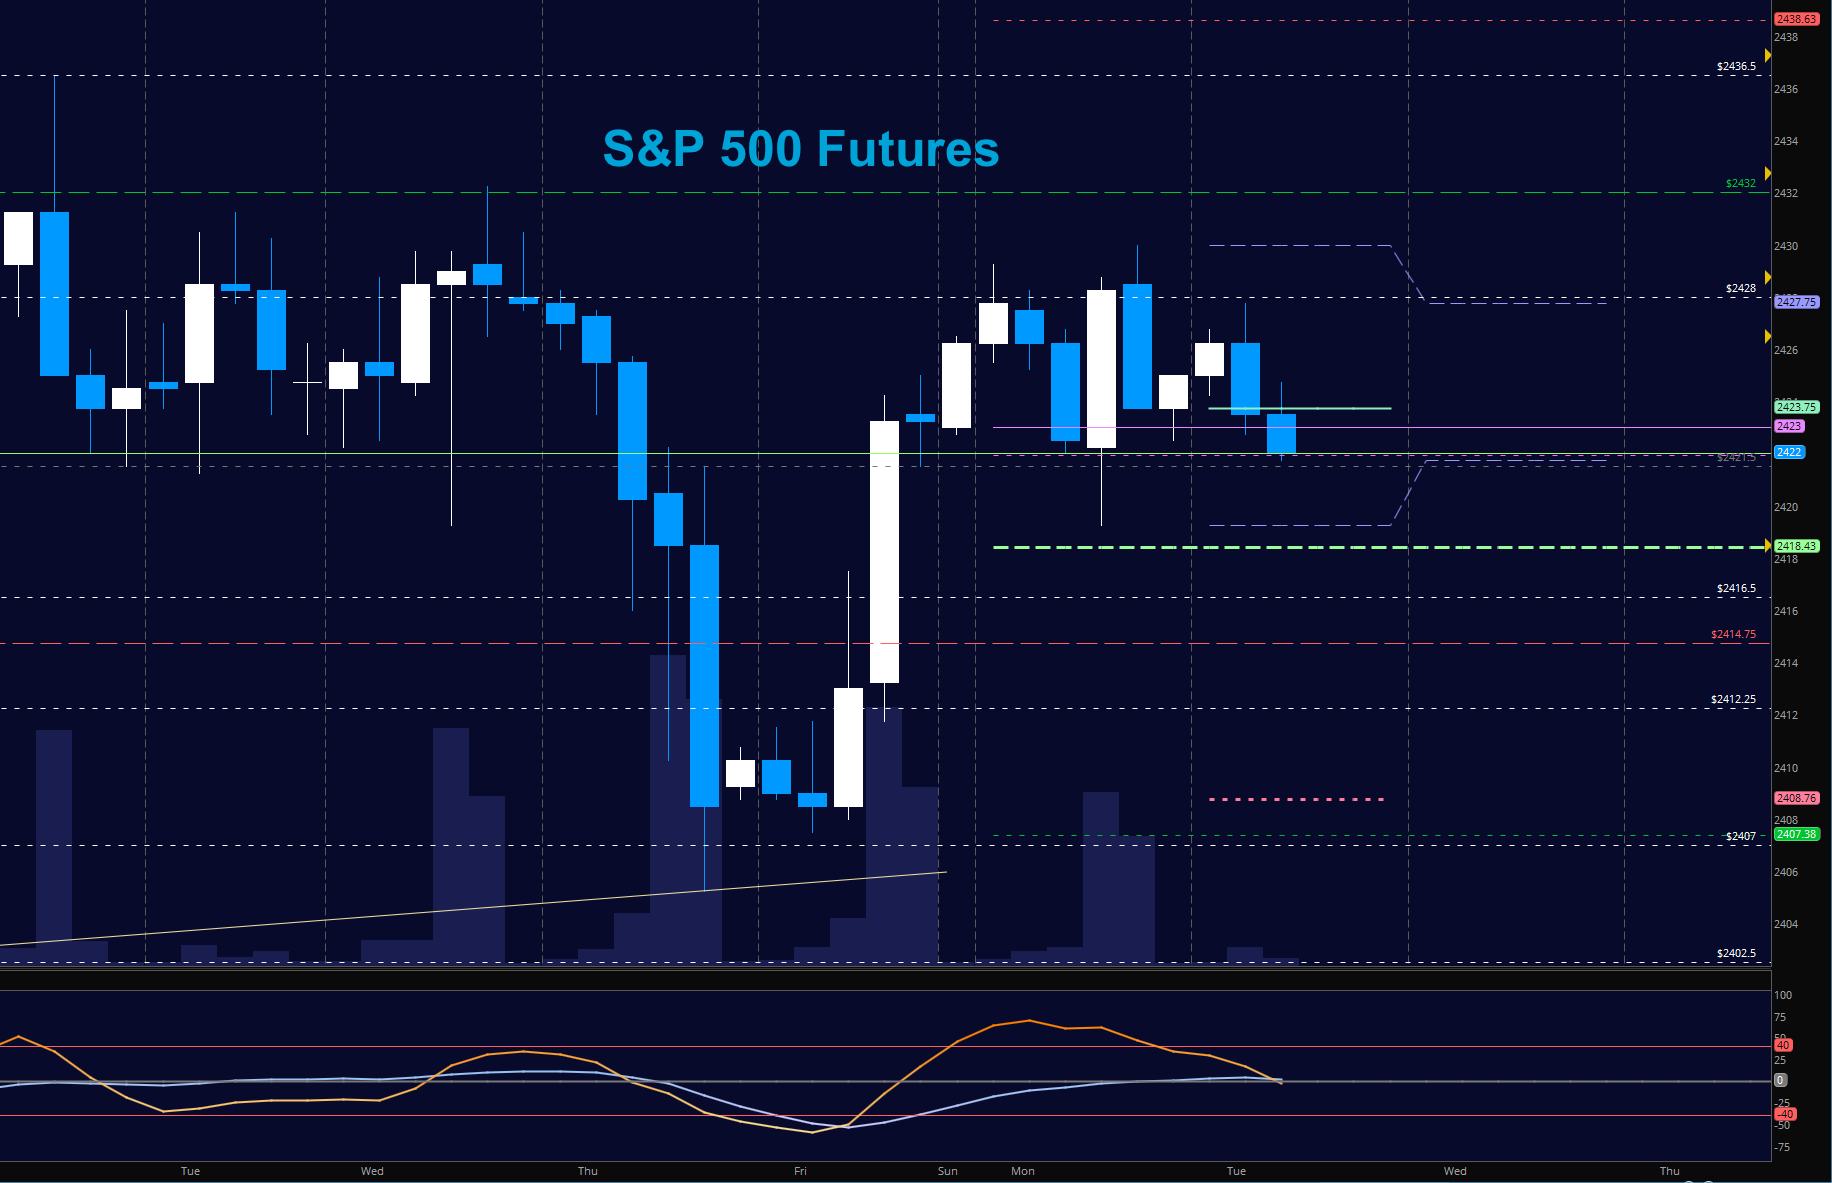
S&P 500 Futures (ES)
Price squeeze tighter as options traders correctly priced the lack of action yesterday. We sit rangebound today with support tests near 2422. Resistance remains at the familiar 2432. Momentum is also unchanged and holds as mixed across time frames, so we’ll need to watch these edges in our ten point range mentioned for changes in motion. The bullets below represent the likely shift of trading momentum at the positive or failed retests at the levels noted.
- Buying pressure intraday will likely strengthen above a positive retest of 2430 (careful again here with resistance)
- Selling pressure intraday will likely strengthen with a failed retest of 2418
- Resistance sits near 2429.5 to 2432.5, with 2446.5 and 2448.5 above that.
- Support holds between 2420.5 and 2412.25, with 2408 and 2402.5 below that.
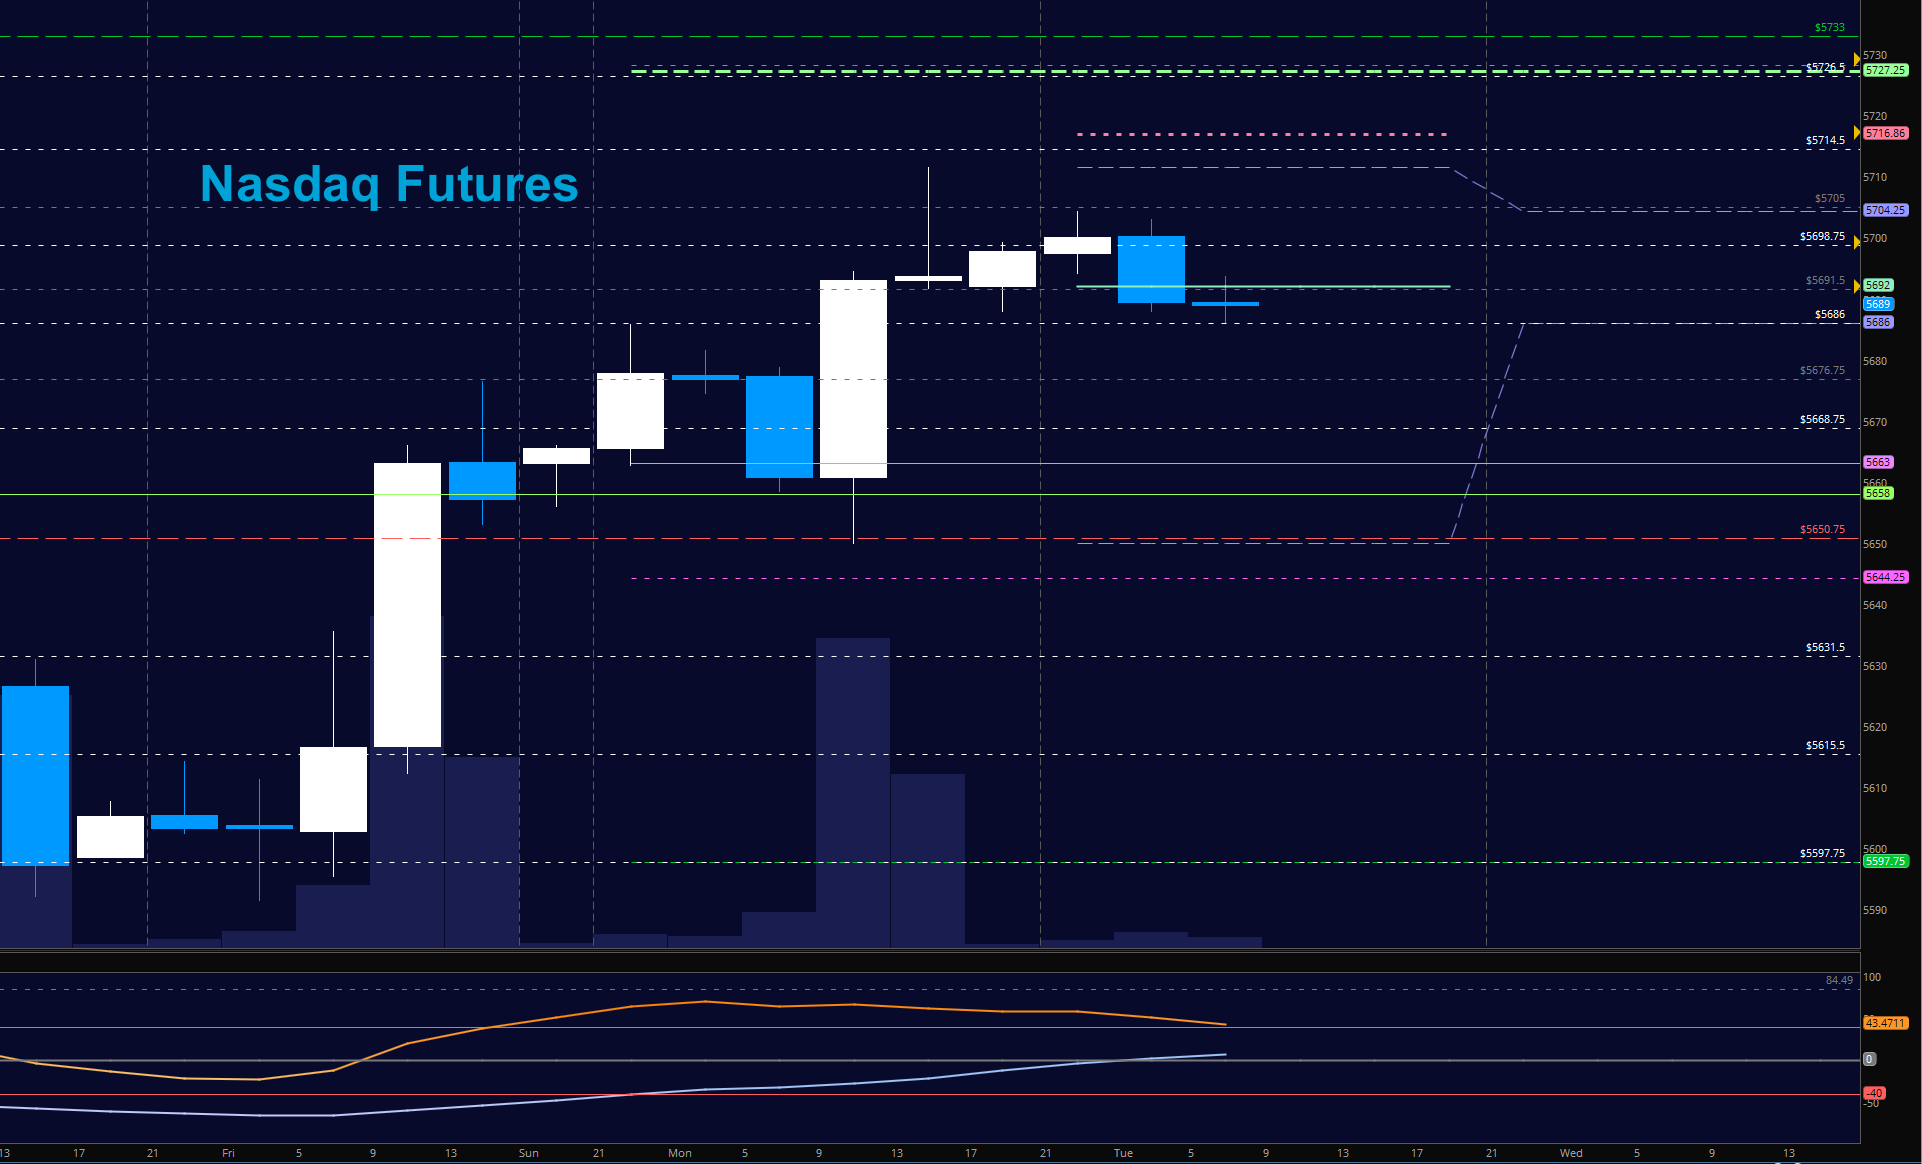
NASDAQ Futures (NQ)
The Nasdaq continues to recover with another nice move upward into areas not seen in several days after its sharp drift downward. Both support and resistance continue to rise with 5660 holding support while 5714 sits as near-term resistance. Ranges have settled down a bit since their expansion. The bullets below represent the likely shift of intraday trading momentum at the positive or failed tests at the levels noted.
- Buying pressure intraday will likely strengthen with a positive retest of 5714.5
- Selling pressure intraday will likely strengthen with a failed retest of 5680
- Resistance sits near 5704.5 to 5714.25, with 5727.5 and 5733 above that
- Support holds between 5680.5 and 5660.5, with 5644.5 and 5597.75 below that
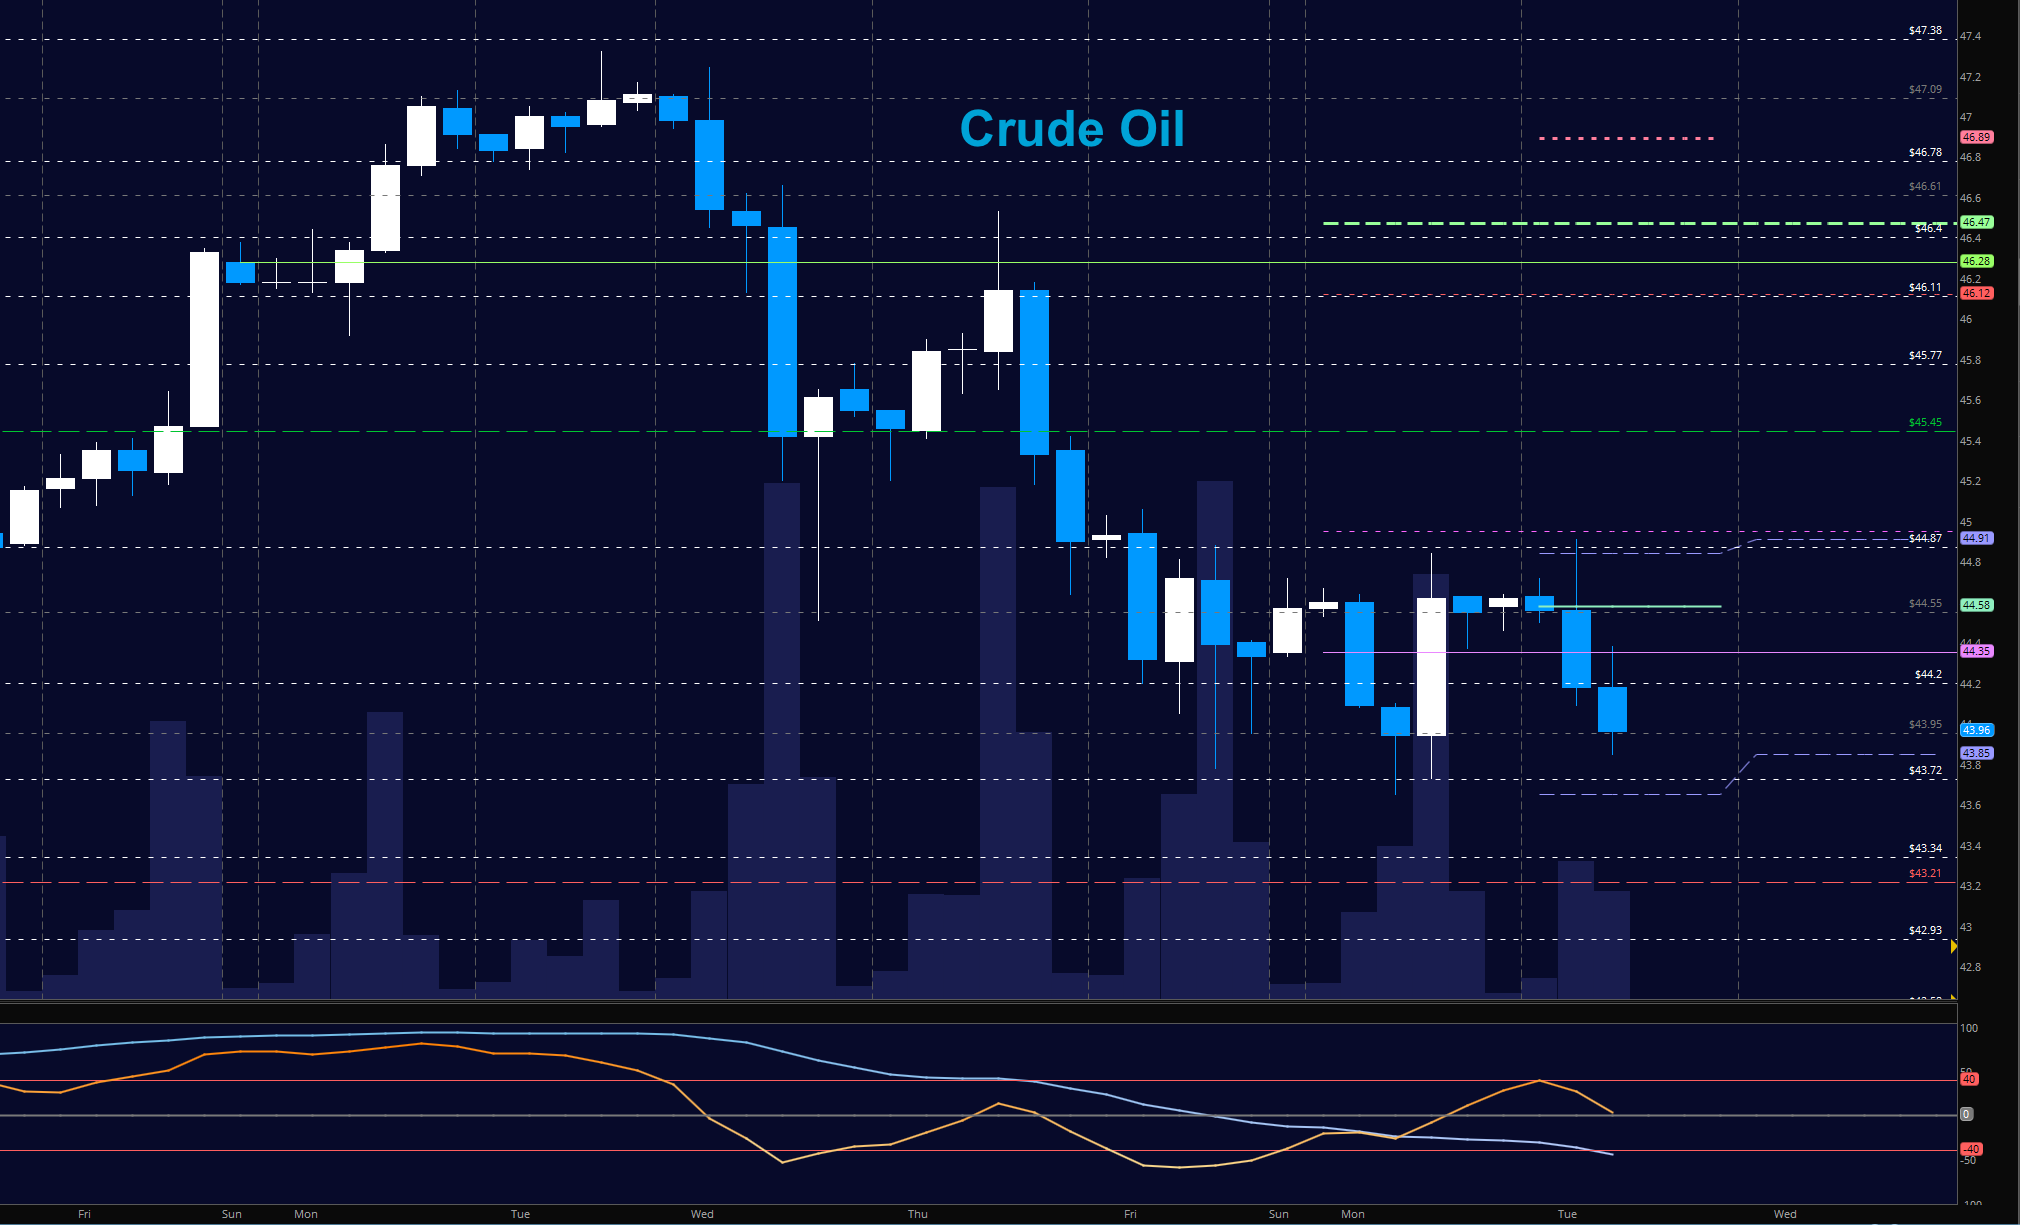
WTI Crude Oil
Oil is now consolidating between 43.7 and 44.9 with the API release due after the close of the day. Momentum is slightly negative, so bounces will find sellers. Careful shorting lows here. Resistance sits near 45.6. The bullets below represent the likely shift of trading momentum at the positive or failed tests at the levels noted.
- Buying pressure intraday will likely strengthen with a positive retest of 44.4 (careful -resistance ahead)
- Selling pressure intraday will strengthen with a failed retest of 43.65
- Resistance sits near 44.65 to 44.9, with 45.45 and 46.11 above that
- Support holds between 43.65 to 43.34, with 42.94 and 42.58 below that.
If you’re interested in watching these trades go live, join us in the live trading room from 9am to 11:30am each trading day. Visit TheTradingBook for more information.
If you’re interested in the live trading room, it is now primarily stock market futures content, though we do track heavily traded stocks and their likely daily trajectories as well – we begin at 9am with a morning report and likely chart movements along with trade setups for the day.
As long as the trader keeps himself aware of support and resistance levels, risk can be very adequately managed to play in either direction as bottom picking remains a behavior pattern that is developing with value buyers and speculative traders.
Twitter: @AnneMarieTrades
The author trades stock market futures every day and may have a position in mentioned securities at the time of publication. Any opinions expressed herein are solely those of the author, and do not in any way represent the views or opinions of any other person or entity.

: Where’s the Deflation in This?")


: Where’s the Deflation in This?")
