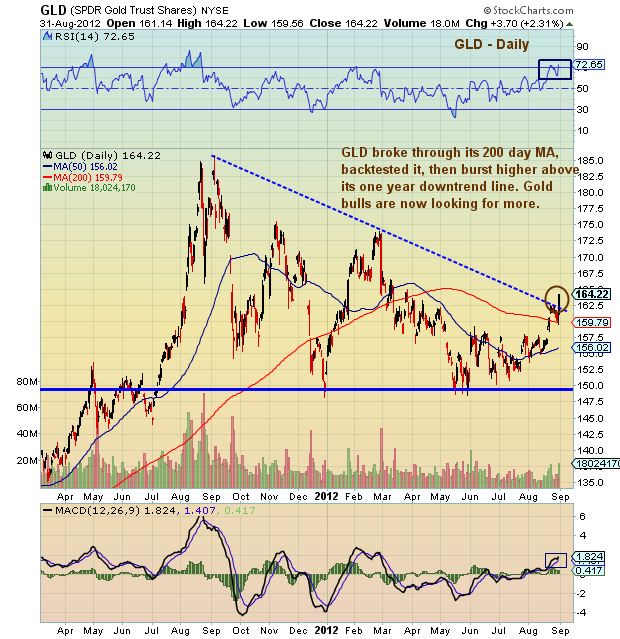
 Not to be outdone by its glitter twin Silver, Gold (GLD) followed suit, breaking higher to new 5 month highs while poking its head above the 1 year downtrend line.
Gold bulls will be looking for some form of follow through and consolidation (either order) over the net week.
More charts found here.
Gold (GLD) chart with technical analysis overlay as of August 24, 2012. GLD Price support and resistance levels with DeMark analysis. GLD chart with trend lines and technical support levels. GLD technical analysis. Gold – precious metals.
———————————————————
Twitter: @andrewnyquist and @seeitmarket Facebook: See It Market
No position in any of the securities mentioned at the time of publication.
Any opinions expressed herein are solely those of the author, and do not in any way represent the views or opinions of his employer or any other person or entity.


