After a terrific run higher, gold and silver prices have corrected and bullish sentiment has cooled off.
That said, gold is trying to bounce from its recent lows…
And bulls are trying to figure out when to get bullish again.
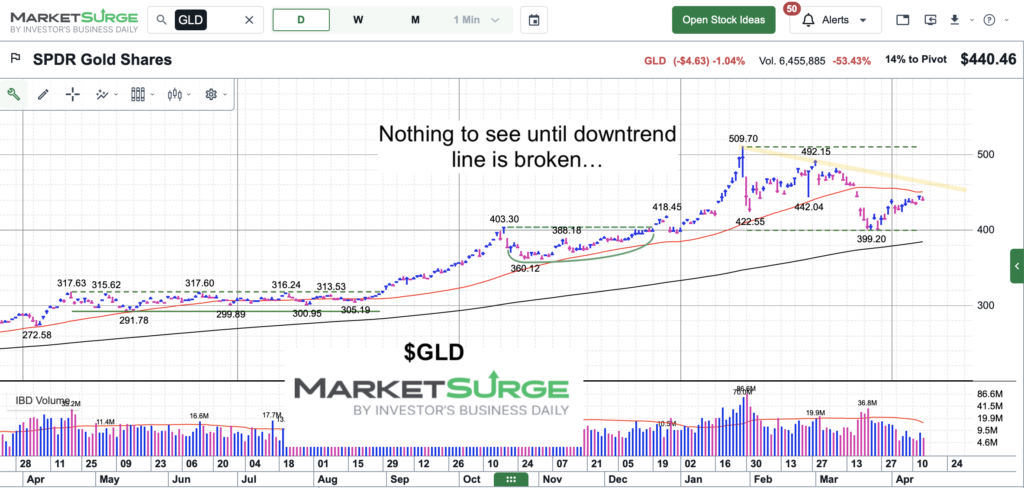
Today, we look at a chart of the Gold ETF (GLD) and highlight the recent down-trend line as an area to watch.
Note that the following MarketSurge charts are built with Investors Business Daily’s product suite.
I am an Investors Business Daily (IBD) partner and promote the use of their products. The entire platform offers a good mix of tools, education, and technical and fundamental data.
$GLD Gold ETF Chart
As you can see, the recent down-trend line is hover overhead (and this is just above the 50-day moving average (also overhead). These should be formidable resistance. A breakout over them would offer new life to bulls that a new trading pattern may offer more than a “bounce”.
Twitter: @andrewnyquist
The author may have a position in mentioned securities at the time of publication. Any opinions expressed herein are solely those of the author, and do not in any way represent the views or opinions of any other person or entity.


