I am back from a 3 week break, but before I took off, I bought the Uranium ETF (NYSEARCA: URA) at $20.
This has been a great trade, but now it is time to think about what is next for uranium and energy (in general).
There is a lot more to think about concerning both the mineral and the nuclear power plants, but for now, lets focus on the price since its peak.
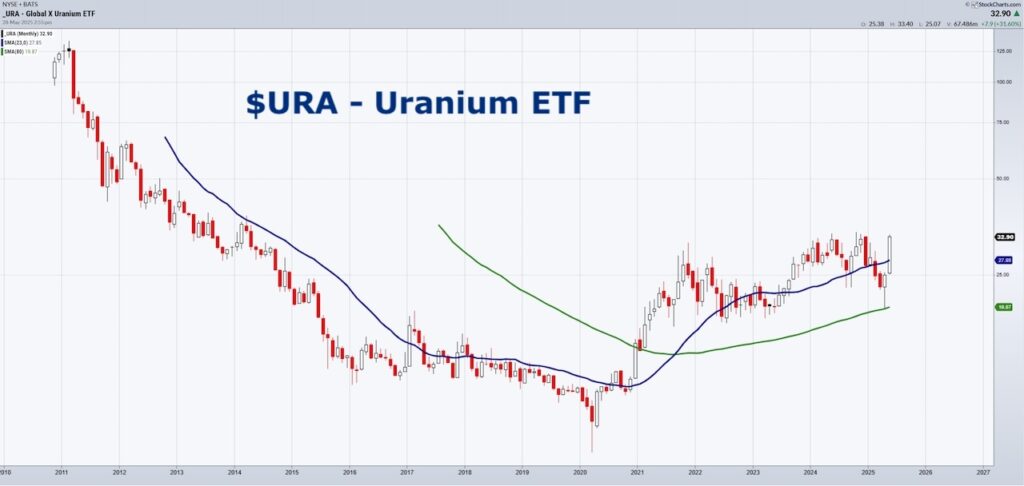
The Uranium ETF (URA) rallied to around $130 per pound in 2011 largely due to a supply-demand imbalance and market speculation, driven by several key factors:
Reasons for Uranium’s Rally to $130 in 2011
- Anticipated Nuclear Renaissance (Pre-Fukushima)
- Prior to March 2011, there was strong global optimism about a “nuclear renaissance” with dozens of new reactors planned, especially in China, India, and Russia.
- Rising demand projections created speculative pressure on uranium prices.
- Supply Constraints and Delays
- Key mines faced production setbacks, especially Cameco’s Cigar Lake mine in Canada (flooded in 2006), tightening supply.
- Long project lead times and high capital costs discouraged quick supply increases.
- Reduced Secondary Supply
- The Megatons to Megawatts Program (1993–2013), which down blended Russian nuclear warheads to fuel, was winding down, reducing secondary uranium availability.
- Speculative and Hedge Fund Activity
- Commodities, including uranium, became a target for hedge funds and institutional investors betting on rising prices due to tight fundamentals.
- Thin trading volumes in uranium spot markets amplified price moves.
Click here to read more about the Uranium chart and get actionable information on key indices and sector ETFs
Then what happened?
- The Fukushima nuclear disaster (March 11, 2011) in Japan caused a sharp reversal in sentiment.
- Japan shut down its reactors, and Germany announced a nuclear phase-out.
- Global nuclear expansion plans stalled, leading to crashing demand expectations.
- Uranium prices began a prolonged collapse, falling below $30 in the years that followed.
As you can see in the monthly chart, URA remained dormant until 2021, when it broke from a 7-year base over the 80 month moving average (green).
Somce then, URA jas held around $20 but could not get sustaining legs above the 23 month moving average (blue) until recently.
However, while the upside of pre Fukushima is there, URA cannot fail this moving average as this is good representation of an expansion in a 2-year cycle that must continue.
The descent in 2011 was dramatic. The dormancy since then was 10-years long.
Now, the optimism must carry URA higher or we can look at this as a great idea, that can take another decade to materialize.
Has URA bottomed? Most likely. Can it soar from here?
If you’re tracking uranium today, the current rally is being driven more by SMR (small modular reactor) political optimism, underinvestment in mining, and geopolitics (e.g., Russian fuel bans).
Twitter: @marketminute
The author may have a position in mentioned securities at the time of publication. Any opinions expressed herein are solely those of the author and do not represent the views or opinions of any other person or entity.

: Showing Some Signs of Emerging Strength")
