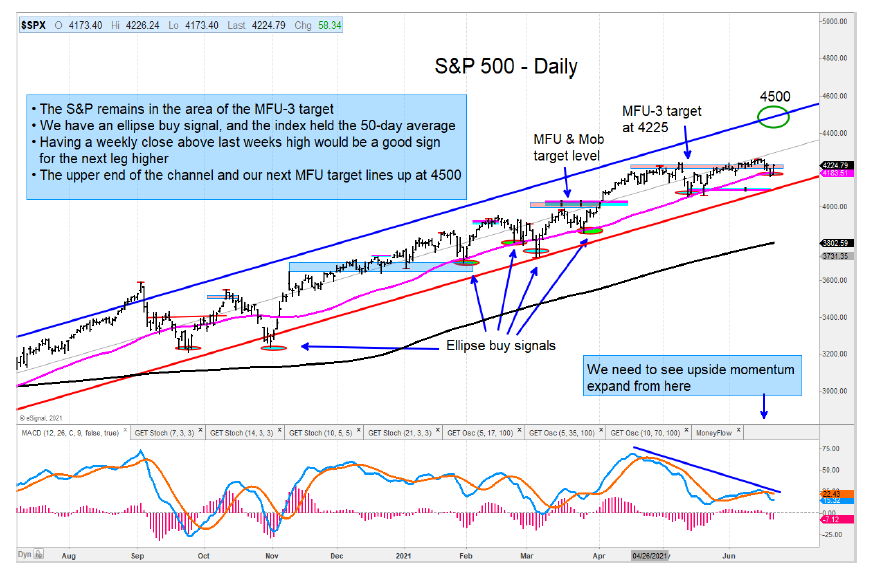
The S&P 500 continues to hover around the MFU-3 investing price target area of 4225.
Bulls should be happy, however, that the S&P 500 successfully tested its 50-day average and reversed higher, triggering an ellipse buy signal.
A weekly close above the most recent high would be positive and will likely lead to the next leg higher. On the weekly chart of the S&P 500, we can see that the index remains contained within its regression trend channel.
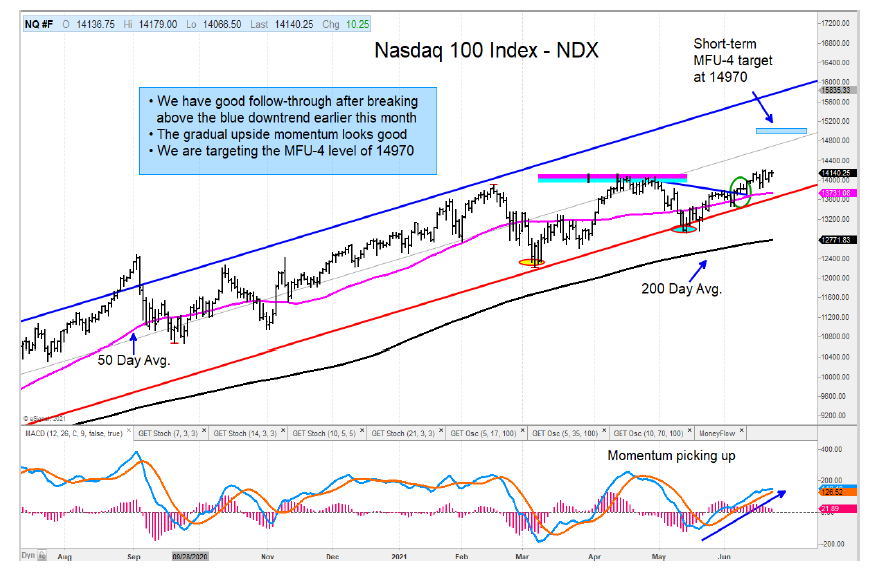
The Nasdaq 100 Index has shown strong upside momentum and is getting close to surpassing the April highs. I am targeting 14970 from here.
Elsewhere, we can see that the Russell 2000 and Mid-Cap Indices have pulled back to support areas that are holding and oversold. We need to see both firm up from here to maintain their uptrends.
I like the turn higher in the iShares Software Sector ETF (IGV). The ETF had a strong move above its downtrend off the January high. Upside momentum is picking up.
The Dow Transports are down nearly –10% off the May high and at trend channel support. Further weakness from here would put the index in a weaker position.
I remain bullish on the energy complex and see higher prices for WTI Crude Oil. The Oil and Gas Exploration ETF (XOP) has pulled back to support and held – a good sign. Trade safe!
The author or his firm have a position in mentioned securities at the time of publication. Any opinions expressed herein are solely those of the author, and do not in any way represent the views or opinions of any other person or entity.


