Inter-market analysis is useful for determining underlying market conditions for active investors.
Several inter-market tools are underutilized because the takeaways aren’t exactly clear and ratios often act differently than stocks.
That said, taking a step back and focusing on the bigger picture really helps tune out the noise.
Here’s a look at some intermarket charts to watch moving forward.
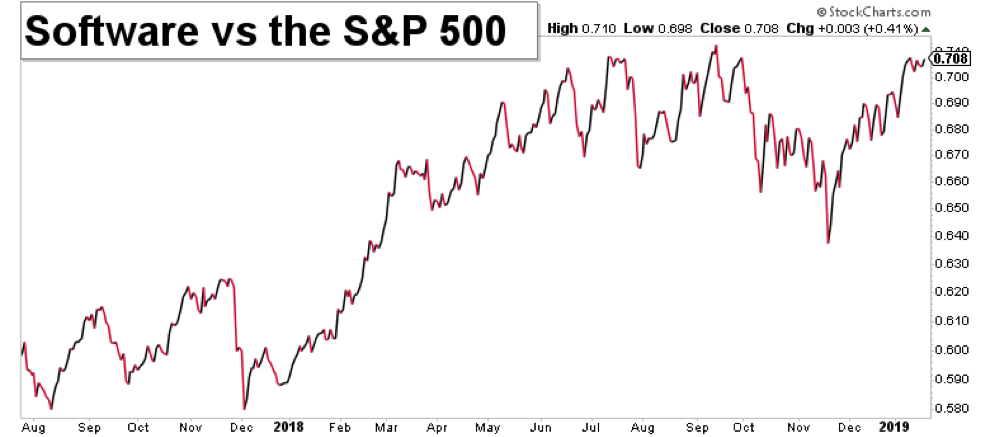
Software Sector relative to the S&P 500
There aren’t many industries with stocks coming out of bases and hitting 52 week highs. Software is one of those groups. Software stocks relative to the S&P 500 is testing the prior highs. We’re watching to see if leadership can continue beyond earnings season.
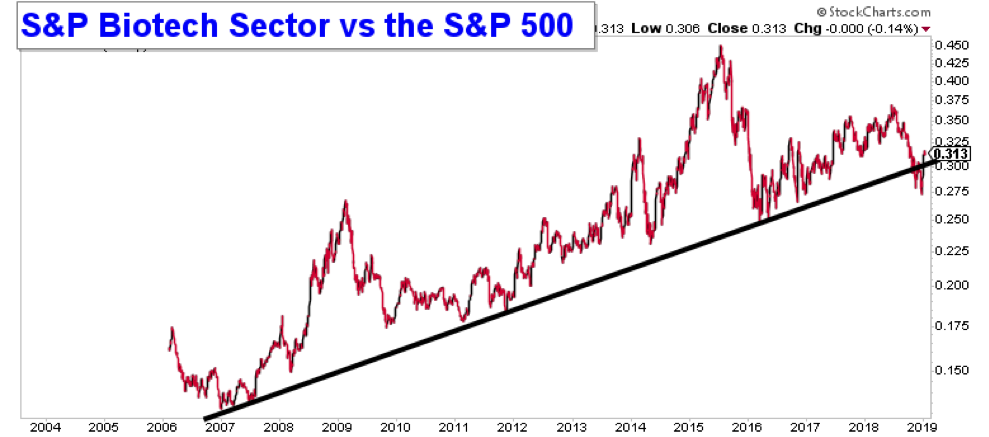
Biotech Sector relative to the S&P 500
Biotech relative to the S&P 500 has trended higher for over a decade. Is this a false break of the trend?
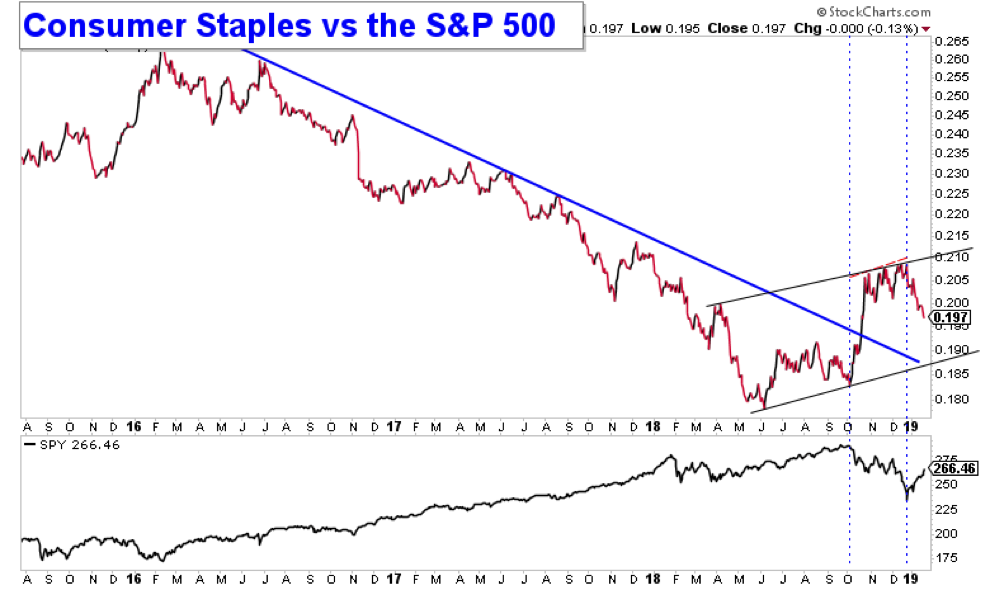
Consumer Sector relative to the S&P 500
Consumer Staples Relative to the S&P 500 has been a telling ratio. It broke trend resistance as stocks rolled over in October while it topped at out as stocks collapsed in December. This is something to watch in the coming weeks for signs of bottoming.
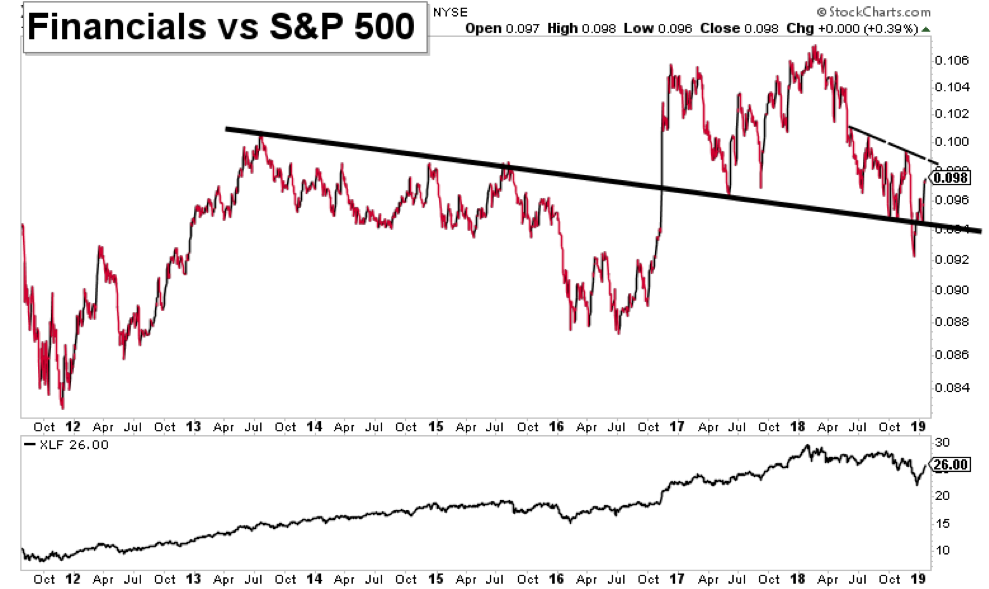
Financials Sector relative to the S&P 500
Financials relative to the S&P 500 found major support at an old pivot line from 2013. Market bulls would love to see a higher high in the coming weeks.
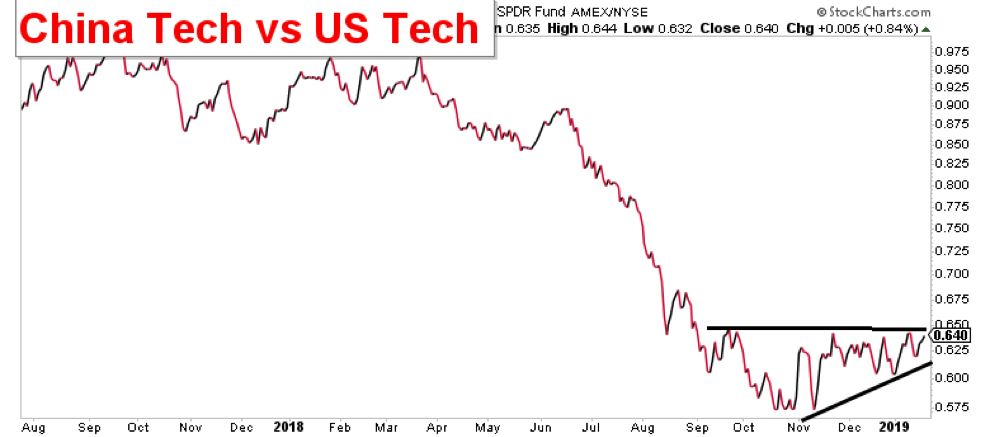
China Technology relative to U.S. Technology
Chinese tech relative to U.S. tech has been in a deep downtrend. Now the ratio is compressed. The direction of the next few weeks could be quite telling. If we’re looking for ‘risk-on’ action out of China and emerging market leadership, this is where we’d expect to see it.
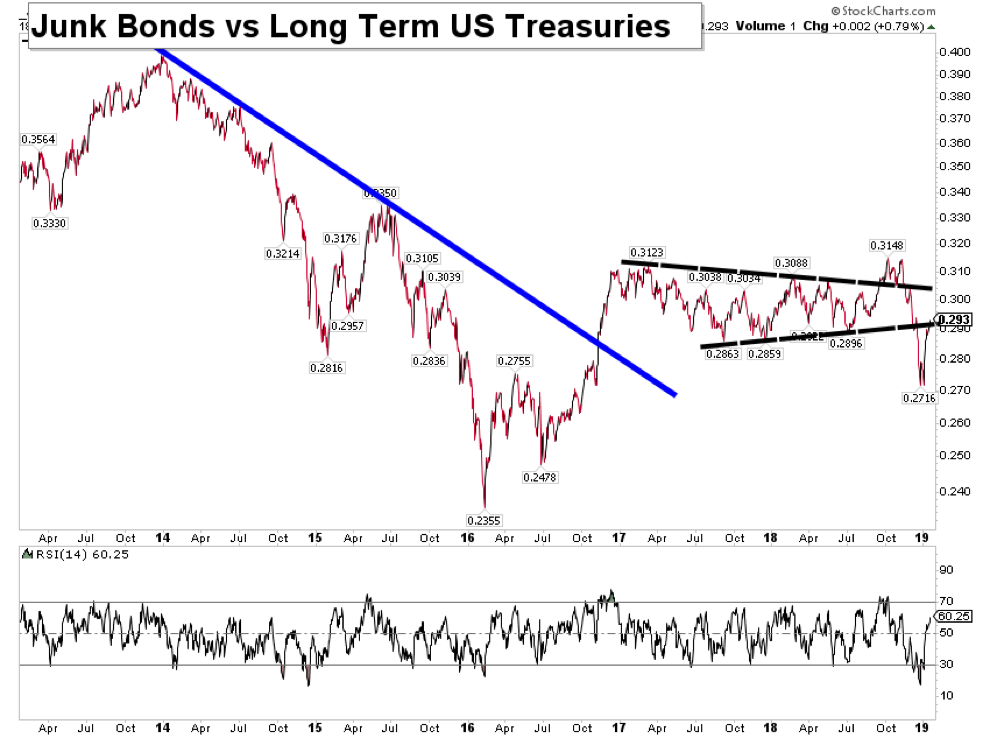
Junk Bonds relative to U.S. Treasury Bonds
Junk Bonds relative to U.S Treasuries broke down hard in Q4 Now the ratio is testing the old base area from below. It’s worth watching to see if this stops now, continues farther into the range or even exceed it.
Thanks for reading. Trade ‘em well.
Twitter: @ATMcharts
Any opinions expressed herein are solely those of the author and do not in any way represent the views or opinions of any other person or entity.


