Gold prices have been chopping in a big sideways range for the past 10 months, leaving gold investors to ponder two very important questions: Are Gold prices still working off the macro oversold levels of the July 2013 momentum bottom? Or is the price of Gold basing for a move higher?
Tough question. Clearly the fundamental back-drop is muddy. Chew on these headwinds and tailwinds that gold investors face:
- Equity markets spent all of 2013 in risk-on mode and are still elevated. (headwind)
- The dollar is still hanging near 30 year lows. (tailwind)
- The economy is ho-hum and the Fed tapering. (headwind)
- Russia-Ukraine showdown and geo-political uncertainty. (tailwind)
- European Elections, quieted retail investors, tempered inflation. (coin flips)
In my humble opinion, I’ve always thought that currency concerns, government (in)stability, and geo-political uncertainty play a heavy hand in the commodity markets (especially Gold). And to be fair, 2013 was a fairly quiet year on that front. But signs of friction have emerged (i.e. Russia-Ukraine) and European elections are just around the corner. Perhaps one of these catalysts, or lack thereof, will play a role in giving Gold a directional bias into late spring or summer.
Back in December, I wrote a post on 4 Gold charts to watch into 2014. Well, I’m still watching them! They have largely defined the current price range that Gold is in and I believe still provide some notable clues and levels to watch for gold investors. Below are updated versions of those charts with an additional monthly chart to boot (ordered from daily to monthly, inside-out analysis).
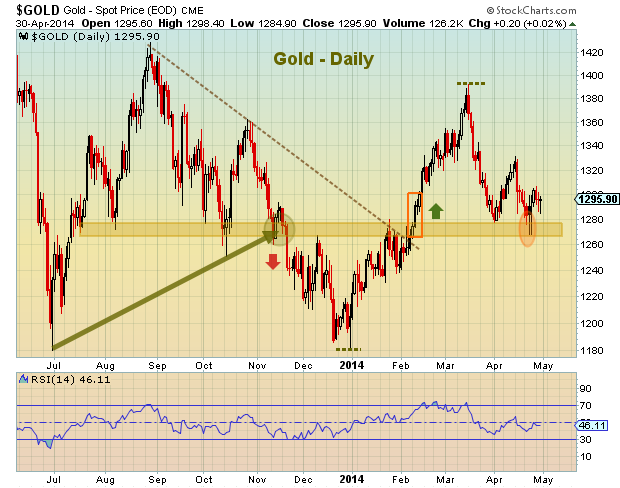
Gold – Daily Price Chart
The daily chart shows that the 1260-1275 level is key over the near-term. If Gold is going to rally from here, it will likely need to hold this level. A break over 1330 and 1400 could come fast. A move below 1260 and a retest of the lows could be in order.
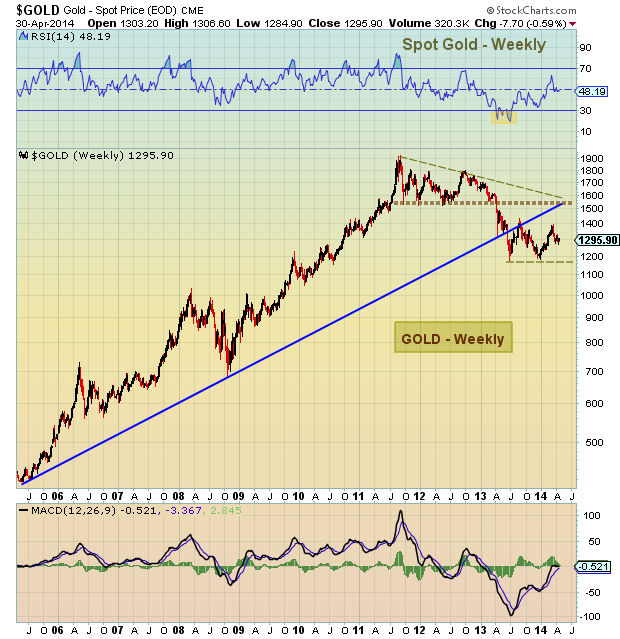
Gold – Weekly Price Chart
On the weekly charts, 1425 shows up as resistance and 1180 as support. A move over 1420 could target 1525, while a move below 1180 may call for a retest of the 2009 breakout over 1000 (see fib chart further down). Back in March 2013 with Gold trading at 1597, I posted about a possible retest of the 1000 breakout level:
Support resides in and around $1400, $1200, and way down near $1000. Although $1000 is not even a consideration for most investors, it does mark the plateau from which Gold prices took off.
At the time, I received some criticism for even considering the possibility. But, what many impassioned gold investors don’t realize is that opportunities often come during downtrends when the herd gives up hope. And further, a retest of that breakout would likely offer a solid buying opportunity.
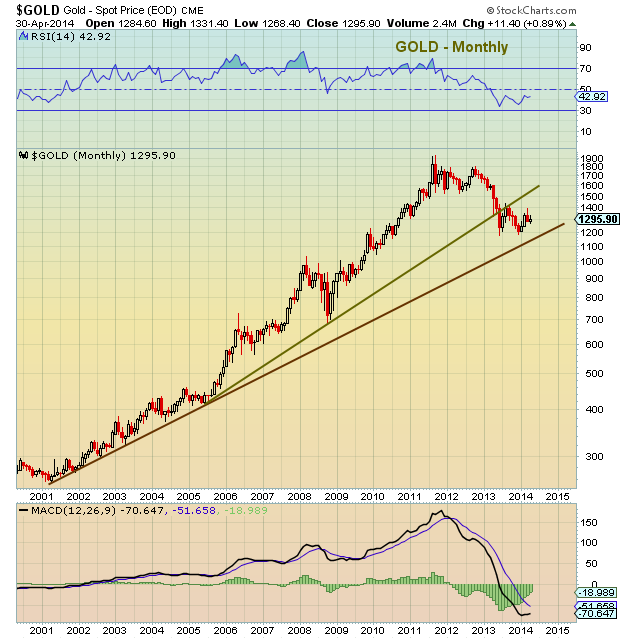
Gold – Monthly Price Chart
The monthly chart simply adds long-term trend perspective. Trend support resides around 1125-1150. BUT, it’s quite common to see trend line shakeouts (where price panics below the trend line for a few days, then reverses).
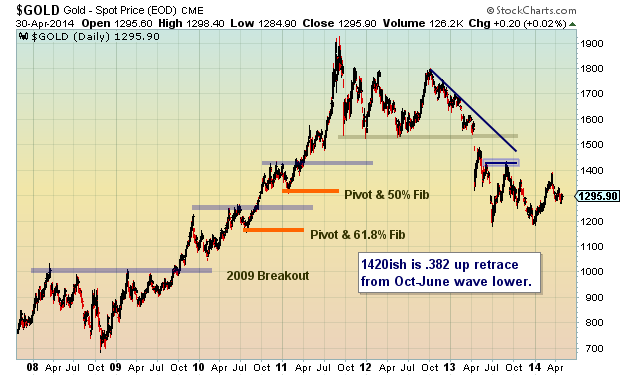
Gold – Fibonacci Chart
The 61.8 Fibonacci retracement level has offered significant support over the past 10 months (in the form of two solid rallies). But price is at a critical stage: A move above 1330 gives the bulls renewed life, while a break below the 61.8 Fib support likely puts 1000-1100 in view.
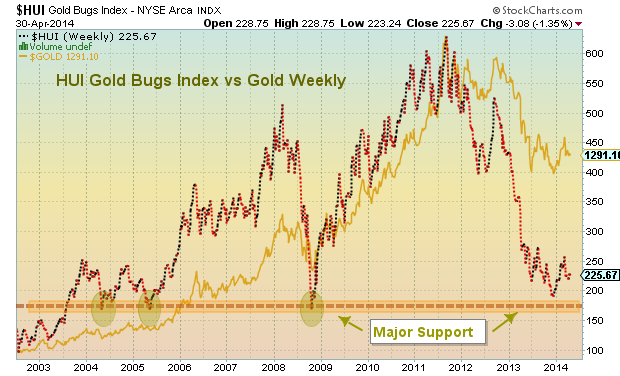
Gold vs Gold Bugs Index (HUI) – Weekly Price Chart
When Gold prices retested the summer bottom in December, the Gold Bugs Index pushed lower into strong lateral support. This provided a nice tradable setup for active gold investors.
The question remains: Will the rally continue, or will the HUI require a deeper retest of that major support?
Trade safe.
No position in any of the mentioned securities at the time of publication. Any opinions expressed herein are solely those of the author, and do not in any way represent the views or opinions of any other person or entity.


