Legendary market strategist Paul Montgomery used to say, “The most bullish thing the market can do is go up.” But are new all-time highs for the S&P 500 as bullish as they seem?
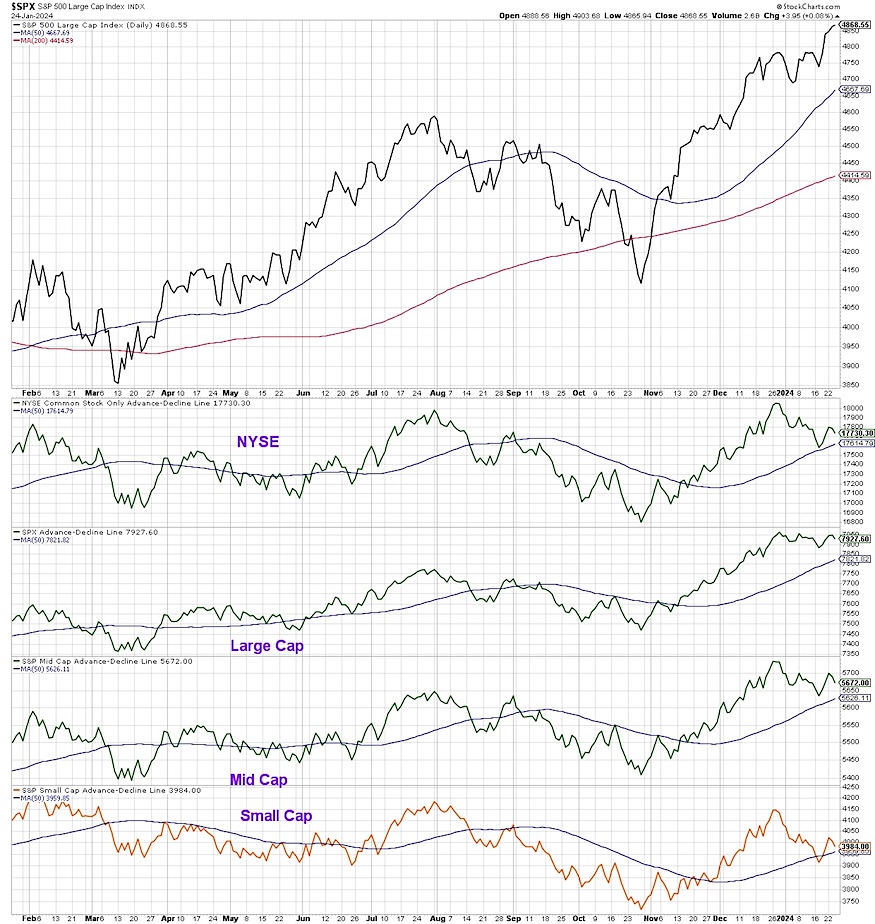
From the perspective of leading growth stocks, the answer appears to be yes. Stocks like META and MSFT have already achieved new 52-week highs in January, and names like NFLX are being propelled higher after reporting earnings. But while the S&P 500 and Nasdaq are breaking out, mid cap and small cap indexes are far from doing so.
Market breadth readings, which appeared excessively bullish in December, have now come down from extreme levels.
In today’s video, I’ll share five market breadth indicators I’ll be watching to gauge the likelihood of further upside for the SPY and QQQ. As you’ll see from the charts, the recent patterns look very similar to previous market tops!
- Will the striking divergence between the S&P 500 and cumulative advance-decline lines signal the end of the current bull phase?
- What does the McClellan Oscillator tell us about short-term breadth conditions as the Magnificent 7 stocks push onward and ever upward?
- Why is an expansion in new 52-week highs such an important guidepost to gauge the strength of current market conditions?
Video: S&P 500 Market Breadth Indicators (Analysis)
Major Stock Market Indices Price Charts
Twitter: @DKellerCMT
The author may have positions in mentioned securities at the time of publication. Any opinions expressed herein are solely those of the author, and do not in any way represent the views or opinions of any other person or entity.


