This article is a collaboration between between Arun Chopra (@FusionPtCapital) and Aaron Jackson (@ATMcharts).
It’s always worth keeping an eye on the Market Bellwethers. You’re not going to get a sustained trend in the markets without them.
So what are some of these Bellwethers telling us today?
Basically, at best it’s going to take some time for a new broad market uptrend to emerge while there is risk of meaningful declines in the coming months. Luckily, we have key levels to watch in many of these names to guide us moving forward.
Today we’ll take a closer look at: Google (NASDAQ: GOOGL), Amazon (NASDAQ: AMZN), Berkshire Hathaway (NYSE: BRK.A), JP Morgan (NYSE: JPM)
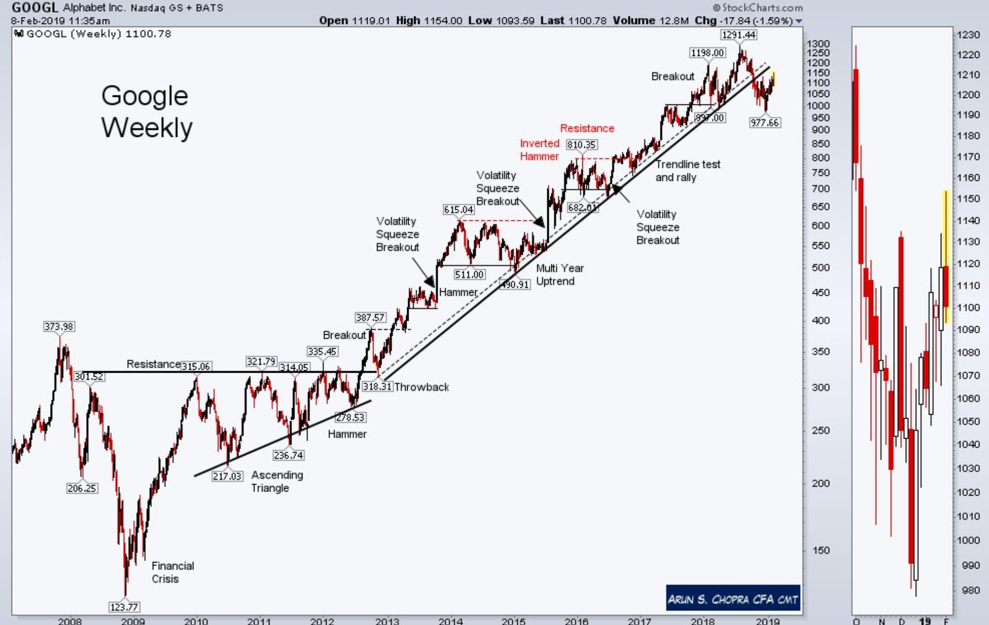
Google ($GOOGL) has broken the dominant multi year uptrend. The big question in the coming weeks and months is is this a larger top in the making. 1200 and 975.
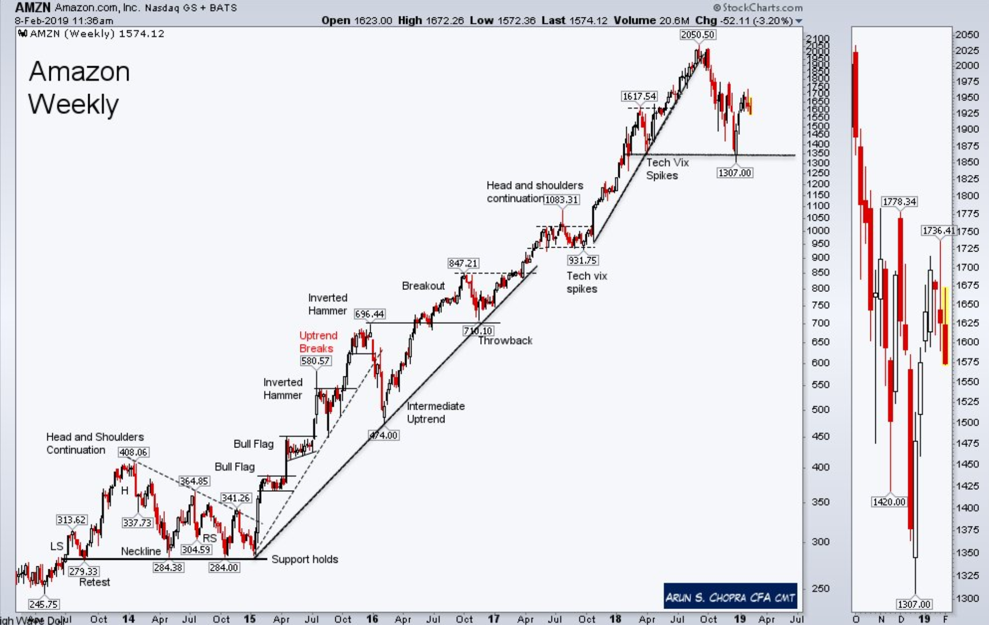
Amazon is in no man’s land. The uptrends from the 2014 base have been very strong, but they just can’t continue forever. As far as we can tell this needs time to digest those gains. For now, price is basing between 1300-1750. A break above that range suggests an rally attempt to the 2018 high area and a move below would suggest potential for a much deeper retrace.
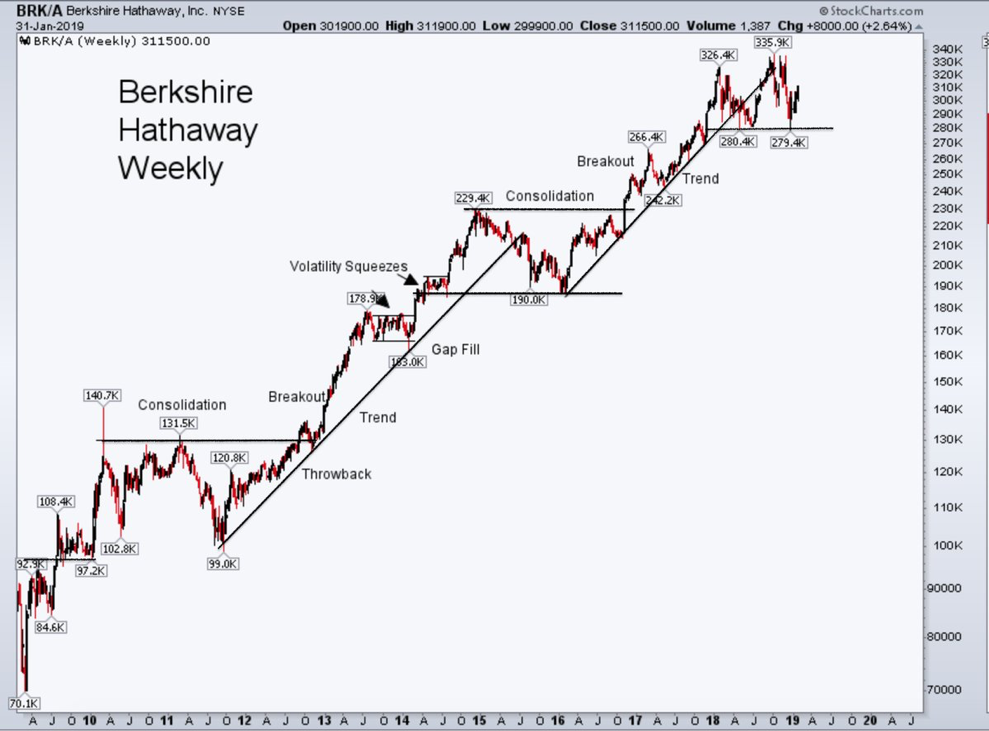
Shifting to Financials, Berkshire (BRK/A) is also in no man’s land after breaking the uptrend from the 2015 lows. One can argue it’s a large top in the making, but we just don’t know yet. The 330K and 280K boundaries are worth watching moving forward.
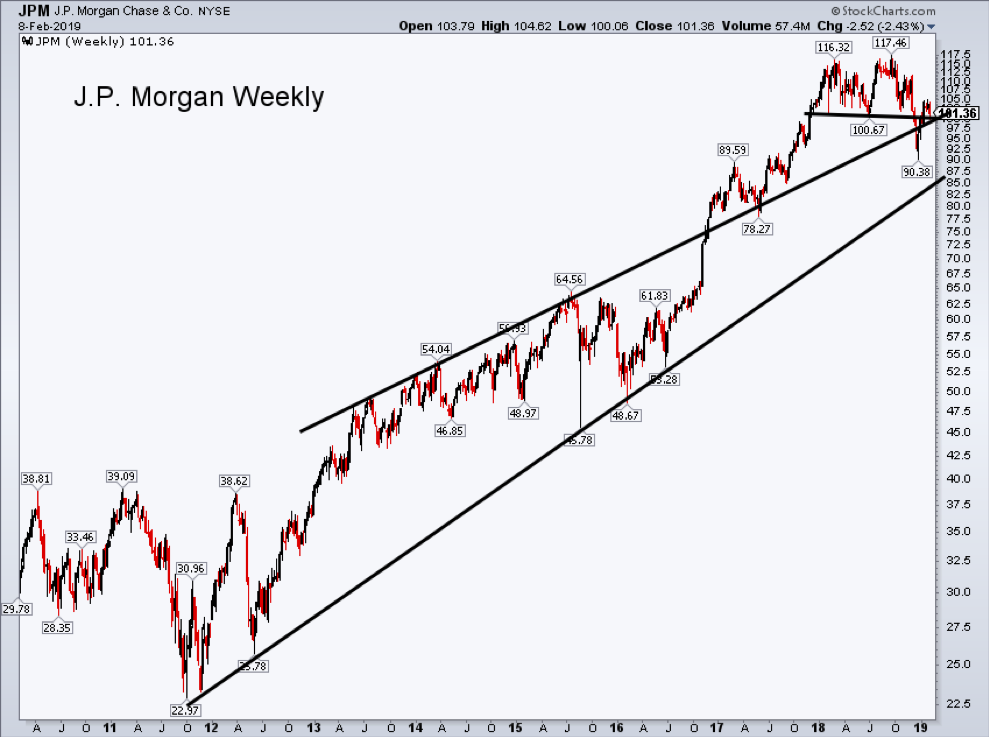
The 100 level in J.P. Morgan is worth watching in the coming days and weeks. It had broken a year long M formation, but now it has regained the key support level. A multi-year trend pivot line also is coming into play around this 100 level. Thus the 100 area is a simple good/bad market tell in the short run.
While some pockets of the market are leading and lagging, the market bellwethers are pretty stuck. We’re just going to have to wait and see how some of these formations and levels play out in the coming weeks and months to figure out the next broad market trend.
Thanks for reading. Trade ‘em well!
The authors may have a position in the mentioned securities at the time of publication. Any opinions expressed herein are solely those of the author, and do not in any way represent the views or opinions of any other person or entity.


