When developing your own trading strategy the adage KISS – “keep it simple, stupid” is an important one to remember. This carries over to deciding which trading tools to use as well.
I had the privilege to learn to trade from some exceptional traders down at the Chicago Board of Trade, and a few guys who’d been trading on the screen since the 80s. They made it very clear that if you want to be in this business for the long term, your trading strategy has to be able to withstand changes in market conditions. Therefore, the fewer moving parts, the better!
There are 3 main trading tools I use to day trade the futures markets. These tools can be applied to any market or time frame and there’s nothing secret or proprietary about them, most every trading platform has them built in.
I’d like to walk you through my three favorite techniques for trading futures and capturing big moves in the markets. So let’s dive right in.
Trading Tool #1 – Tick Charts
My chart of choice is a 512 tick chart. A tick chart is simply a way of looking at the markets based on the # of trades that take place, versus a traditional time based chart where you’re looking at trades over time. So a 512 tick chart means that after 512 trades occur the candle closes.
A tick chart is made up of bars which are based off a number of market transactions (as opposed to elapsed time).
Most charting packages will default to the standard time based chart where each bar forms after a specified amount of time has passed (1-min, 5-min, 15-min etc.). The tick chart allows us to break down the bar into number of transactions (144, 233, 512, etc.).
These numbers are a little more ambiguous than your typical time based charts, but tick charts have some distinct advantages. The most relevant is the ability to view price charts in a variable other than time, but time does play an important role.
Since tick charts are made up of bars which form after X # of transactions the amount of time it takes for each bar to close (or series of bars to form) tells us a lot about the volume of the markets.
Periods when bars are forming faster indicates more volume moving the markets. When bars are slower to form this is indication of lower volume.
The two charts below are a great example of how to interpret volume within tick charts:
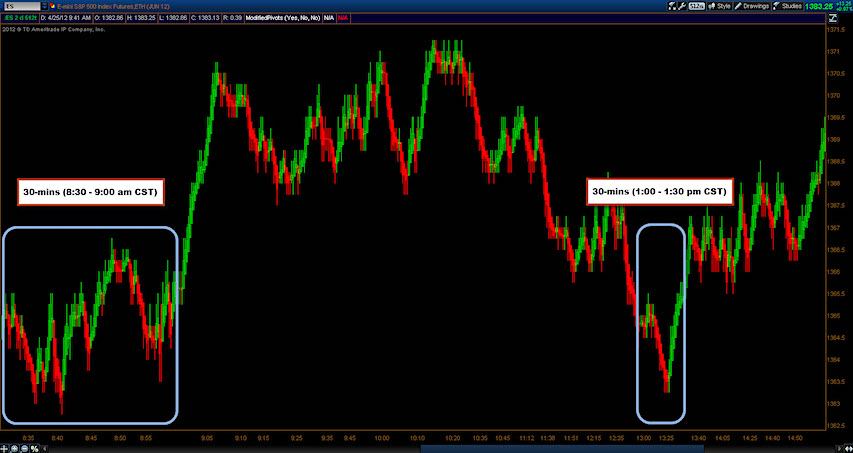
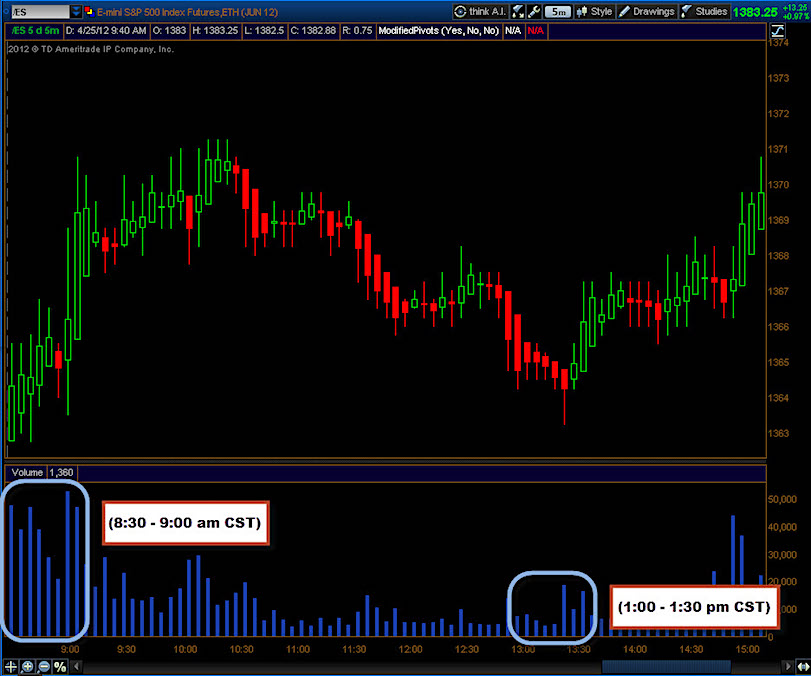
While the size of each individual transaction is unknown, larger positions are commonly broken up into smaller orders and this creates more transaction, thus a shorter amount of time before each candle closes.
So for example, a larger order of 10,000 contracts might be filled over the course of 5-10 smaller orders. In order for the market to absorb this order, many smaller orders will be filled to match the other side of this trade.
In addition to the tick chart, there are two other types of data-based chart types, range, and volume charts. Range charts print bars which close at the end of a specified data interval (ex: after a 1.0 pt range is traded).
Volume charts, are similar to tick charts, except their bars close once a certain number of contracts have been traded. These charts are all unique in their own way and put a nice spin on the standard time based chart.
Trading Tool #2 – Heikin Ashi Candlesticks
As opposed to a traditional candlestick chart, I prefer to use a Heikin Ashi candlestick. This type of candlestick makes the trend and trend changes easier to spot. Have a look at what a Heikin Ashi candlestick series looks like.
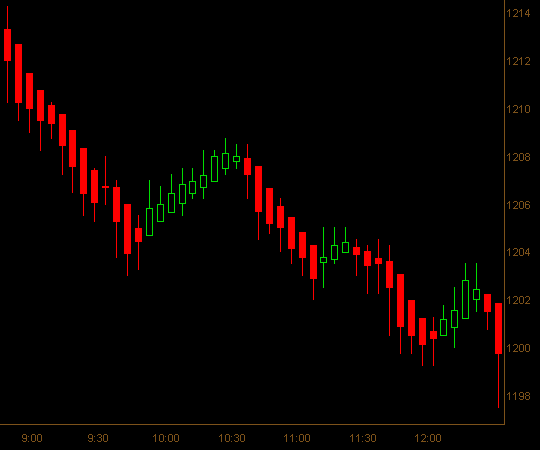
Notice how the trend is strung together with a series of red and green bars. These bars make up a clear trend, red bars in a down trend and green bars in an uptrend. The main difference between a traditional candlestick and a Heikin Ashi candlestick is each candles relationship to the prior bar.
A traditional candlestick is made up of an open, high, low and close price. The Heikin Ashi candlestick operates using those four attributes, except in place of the opening price, the midpoint of the prior candle is used. This is what makes the candles form such clean trends, and provide a more definitive signal when the trend is changing.
Below we compare the traditional candlestick study with the Heikin Ashi chart study:
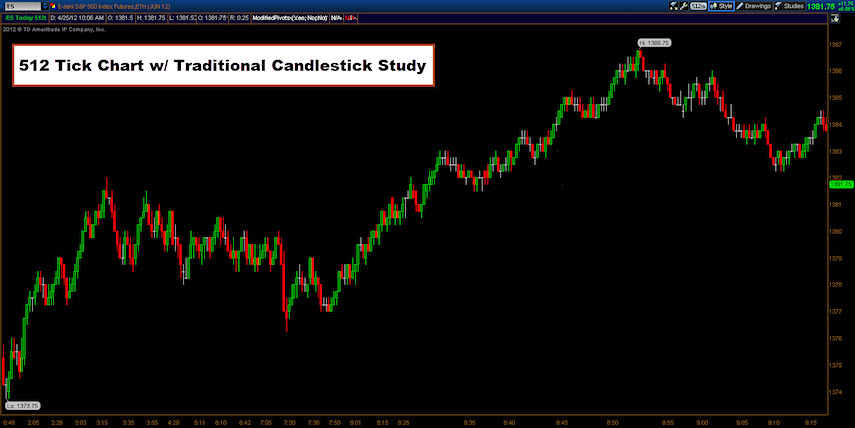
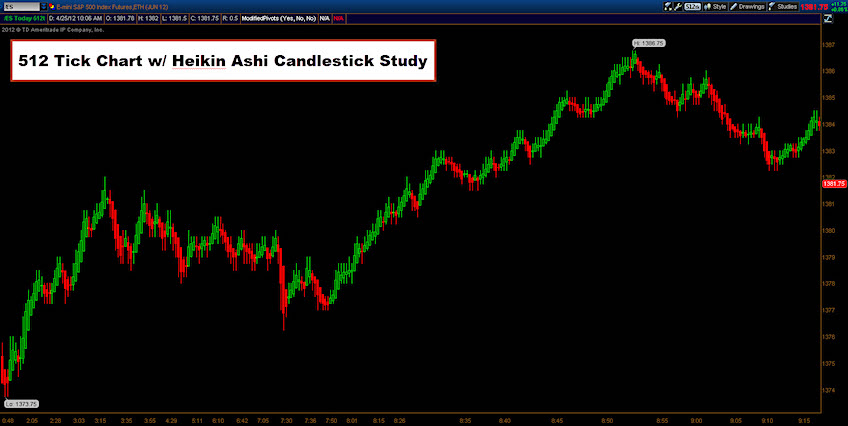
Of all the bar chart types out there I prefer the combination of the tick chart with the Heikin Ashi Candlestick. This combination is a crucial part of my chart setup for day trading the futures markets.
I use thinkorswim® for my charts (now powered by TDAmeritrade), but most charting packages have Heikin Ashi candlesticks built in as well as the capability to view the chart’s X axis in ticks instead of time.
Trading Tool #3 – Fibonacci Retracments
When you combine the tick chart with the Heikin Ashi candlestick study you get a nice clear picture of the current market trend (or lack thereof).
Trending markets are easy to identify with clean bars of the same color forming one after another whereas range bound markets will appear choppy, with bars changing color more frequently.
The key to trading Fibonacci retracements is to begin by identifying the trend, then wait for the market to pullback or, in the case of a down trending market, wait for price to bounce and move up into the Fib retracement.
Trading Fibonacci retracements is a low risk/high reward entry approach that has been around for a really long while. It’s incredible how well the markets retrace and react at a simple 50% retracement. When we take a look at Fibonacci retracements and the golden rule as it occurs in nature, they really can be found everywhere.
I trade using the Fibonacci retracement levels of 61.8% as my failure point, or point at which the trend has failed. The -23% line as my target (also called the 123% level). This is simply a level roughly 20% beyond highs or lows. Then for my entry, I’m using a retracement (or bounce) to the 50%.
These patterns present themselves day in and day out in all the markets and time frames. I like to combine the 512 tick chart, with the Heikin Ashi candlestick and using my Fib tool, draw up retracements on the chart, looking for entries at the 50% line.
Have a look at a basic setup on the chart below. These types of setups happen every day in the markets.
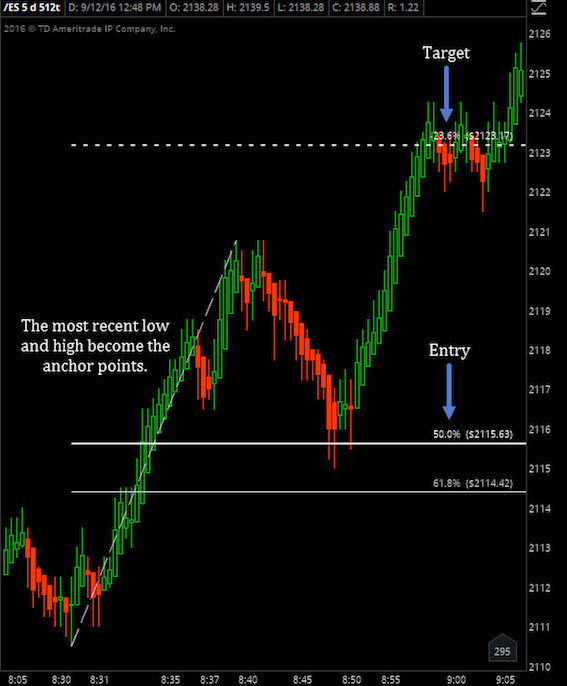
Again, I like to enter at the 50% level (or just ahead of it). This allows the market to pull back after establishing an initial trend. So let’s say the initial move is upwards, I simply wait for the market to pull back (move down) to the 50% line and that is where I place my long entry.
Once the market makes a new high and goes roughly 20% beyond that high, I get out, simple as that. Think of it as walking into a party 30-mins after the doors open. You already know there’s a party going on, people are already inside, and the line to get in is gone. Thus, you walk right up and get right in without waiting.
This approach is counter to most newbie traders who chase highs and lows as the move is happening only to get stopped out shortly thereafter. If you don’t want to end up like everyone else, then you can’t do what everyone else is doing.
So pull up a 512 tick chart, add the Heikin Ashi candlestick study and Fibonacci tool and take a look for yourself. After a couple hours of looking at the charts you’ll start to see these setups everywhere!
For more specifics on my rules for trading the futures markets you can visit EminiMind.com/trading-rules a comprehensive guide I put together that acts as the framework for my trading.
Twitter: @EminiMind
Any opinions expressed herein are solely those of the author, and do not in any way represent the views or opinions of any other person or entity.


: Showing Some Signs of Emerging Strength")
