What is the likelihood the past repeats itself? I don’t have to tell you that those odds are pretty low. Monte Carlo simulations allow us to build general ideas of what to expect in the future.
No one can predict the future, but if we can simulate potential outcomes then we can make better informed decisions on how to take risk today.
A Monte Carlo simulation is one tool that can help us create a range of possible outcomes to make better decisions regarding uncertainty and risk. But did you know there were multiple ways a trader and money manager can use Monte Carlo tests?
Side note: Every test has its own assumptions, failures, and difficulties. If any test were a perfect test then you’d only need that one test – which I am not claiming to be the case. This post is not about Monte Carlo being perfect – but rather it being part of your larger suite of testing tools. Finally, outside describing some benefits of Monte Carlo simulations, I’ve also assumed you’ve followed proper testing steps to generate reliable trade results to be used in a Monte Carlo simulation! I have other posts to get you to that point; email me with any questions.
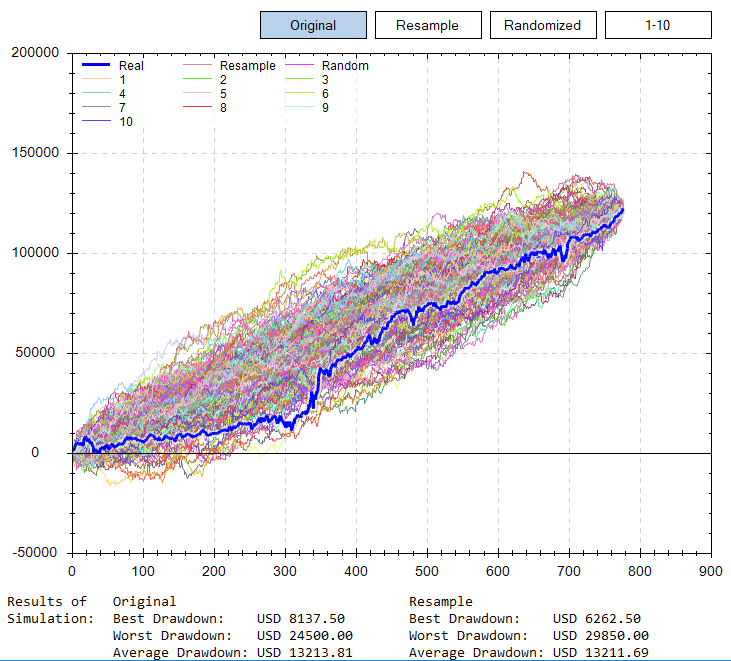
1. Original (and Resample) Monte Carlo
a. This is the most visually popular Monte Carlo simulation. We simply take the backtest’s trade results and reshuffle their order. We do so 1000 times. Now we have 1000 ‘new’ equity curves that allow us to have a better look at the potential risks we may assume when trading this strategy. The underlying assumption is our trade results should be similar but not in the same order as the past.
b. Now we can calculate some basic statistics like the average drawdown of these new 1,000 equity curves. Most times you will notice this average drawdown is higher than the backtest’s drawdown. It is very wise to use the average drawdown (or even the worst drawdown) from the Monte Carlo simulation when considering sizing and allocations to a trading system compared to using just the original backtest’s drawdown.
How can we use this?
1. Better expectations. Imagine trading a system that had backtest drawdown of 8% and you sized based on this. However, live trading sees a drawdown of 12%. You turn the strategy off. However, the Monte Carlo would have told you a drawdown of this level was to be expected. The strategy rallies from here but you’re on the sidelines because of improper sizing.
2. Understanding when to expect profitability. Strategy is flat to down after 50 trades. Is this normal? Same scenario – trader turns perfectly good system off while trader who analyzed Monte Carlo understood this likelihood and that all simulations were not greater than $0 until after trade 75.
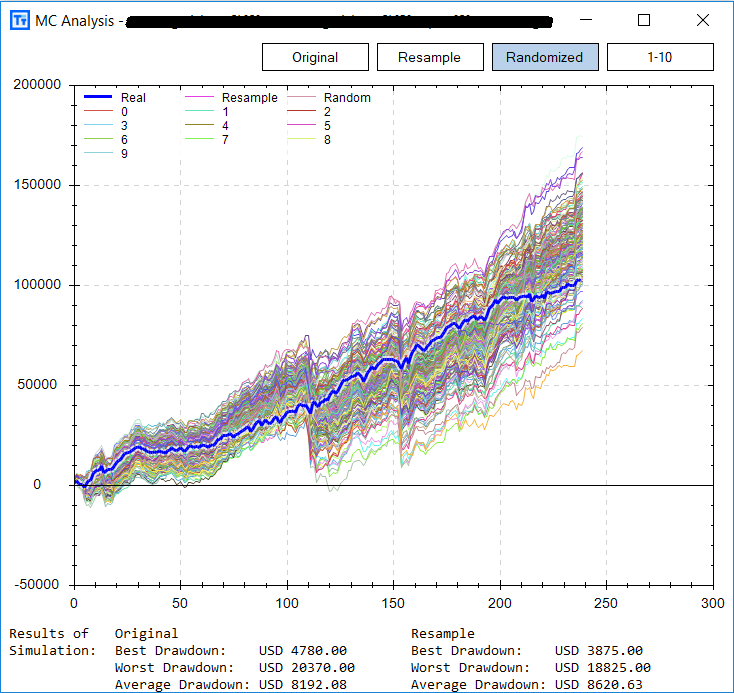
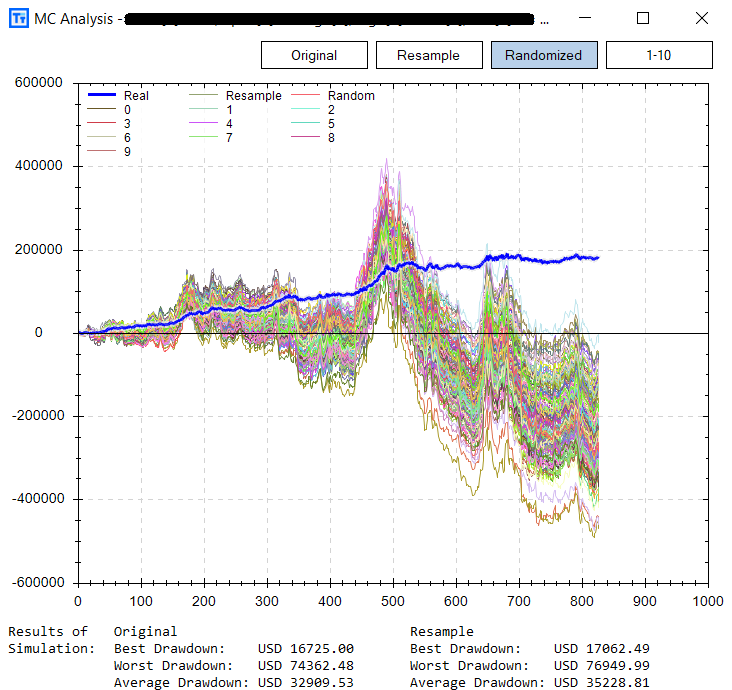
2. Randomized Monte Carlo
The Randomized Monte Carlo test is one of the many tests offered in Build Alpha to check for overfitting in the strategy creation process. Randomized Monte Carlo re-trades each entry signal from the backtest but uses a random (yet appropriate) exit for each signal and then repeats this process 1000 times. Again, leaving us with 1000 new equity curves to analyze.
The idea is… if our trading signal is strong enough it should generate profit regardless of the exit(s) used. Of course, using random exits will not produce as smooth of returns as our original exit(s), but the signal should still maintain general profitability.
If the system does not maintain profitability with random exits then it is likely our original entry signal was overfit to the historical data and the system can be discarded before any real money is risked!
How Can We Use This?
The first image is a ‘passing’ randomized Monte Carlo. You can see the random exits maintain general profitability, but the original exits do smooth out and improve returns (there is edge in these exits).
The second image is a ‘failing’ randomized Monte Carlo. A great backtest, but you can see the random exits cause the signal to fall apart. This shows a weak (and possibly overfit) entry signal. Luckily, we identified this possibility before risking real money – what is that worth to you!?
3. Monte Carlo Drawdowns
I briefly mentioned we could use the first Monte Carlo test to get better expectations surrounding potential drawdowns and risks our strategy or portfolio might experience. However, using a Monte Carlo simulation to analyze drawdowns can help us actually size our strategies more appropriately.
The Monte Carlo Drawdown test allows us to assign confidence to what levels of risk we may assume. The test works as follows…
- User specifies starting capital amount
- Run Monte Carlo simulation (original or resample MC)
- Record all 1000 maximum drawdowns as percent of starting capital
- Plot 1000 maximum percent drawdowns as frequency distribution (green bars below)
- Follow the cumulative distribution (blue) line up to 95% on the Y axis
- Find associated x axis value (drawdown %) with 95% on Y axis along blue line.
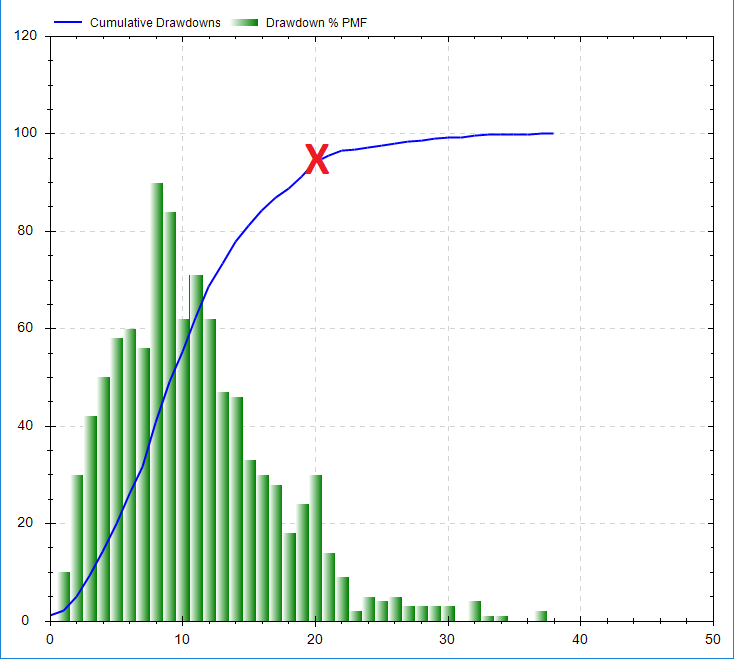
This allows us to conclude that 95% (y axis) of all Monte Carlo simulations are below 20% drawdown (x axis). In other words, we have a 5% chance of experiencing a drawdown greater than 20%. If a trader cannot live with those numbers than re-run the test while increasing the starting capital in step 1. Repeat this until you find a drawdown amount (with 95% confidence) you are comfortable with.
How Can We Use This?
There are many times a trader may find a great looking strategy but cannot actually put enough capital behind it to comfortably trade it – this is rarely talked about.
Properly sizing strategies allows us to (sleep at night) stay with a system’s inevitable down periods and ride out enough trades to allow the law of large numbers to play in our favor. Sizing appropriately can be the difference between hitting max pain too soon, turning it off too soon, or comfortably allowing the law of large numbers to play out.
Anyways, I hope this shows three unique ways to take a deeper dive into your strategy testing and ultimately leads to more calculated risk taking. Far too many want to risk too much and simply rely on backtests (hint: it is not enough Noise Test). Proper testing and deep dives into strategies can be the difference between ‘part-time’ trader and a robust portfolio.
As always… thanks for reading, And PS Pretty big Build Alpha update coming soon! Thanks for all the patience as I continue to build it out.
Twitter: @DBurgh
No position in any of the mentioned securities at the time of publication. Any opinions expressed herein are solely those of the author, and do not in any way represent the views or opinions of any other person or entity.


: Showing Some Signs of Emerging Strength")
