This article is the first in a series co-authored by David Fabian (fmdcapital.com) and Aaron Jackson (northstarta.com). Each week we will be unlocking the secrets to some of the most talked-about exchange-traded funds in the market. The goal is to better understand what you own or elevate new ideas to the forefront of your watch list.
Know What You Own: A Closer Look At Low Volatility ETF’s
Many investors have been caught off guard this year with the sharp drop in stocks combined with a rush to safety in traditional defensive asset classes. This week we will be reviewing a trio of diversified low volatility ETFs designed to hold stocks with lower historical price fluctuations than traditional market-cap weighted benchmarks. These tools can be useful for more conservative investors that are seeking to maintain an allocation to stocks with the goal of mitigating downside risk.
Reviewing The Playing Field – David Fabian
The largest ETF in this space is the iShares MSCI USA Minimum Volatility ETF (USMV), which has over $8 billion in total assets. USMV contains exposure to 168 large and mid-cap stocks with top holdings in well-known names such as AT&T Inc (T) and McDonalds Inc (MCD). As one of the more popular low volatility ETFs, this smart beta fund carries a modest expense ratio of just 0.15% as well.
The USMV portfolio is constructed according to rigid constraints on individual stocks, sectors, and overall price sensitivity of each holding. While the structure of this ETF is that of a passive index, it’s holdings are regularly evaluated to ensure they are maintaining minimal price fluctuations relative to their peer group. In addition, the multi-sector approach allows for this fund to be suitable as a core holding in conservative portfolios and not just a short-term defensive hideout.
The PowerShares S&P 500 Low Volatility Portfolio (SPLV) is also well-regarded in the class of low volatility ETFs with over $5 billion in total assets. SPLV takes a variant approach by taking the 100 lowest volatility stocks in the S&P 500 Index and equal weighting each underlying holding. The end result is a deep pool of quality large-cap stocks with high concentrations in financials, consumer staples, and industrial companies.
SPLV charges an expense ratio of 0.25% and has a unique feature of providing monthly distributions to its shareholders. This type of regular dividend stream may be an attractive characteristic for income investors and the fund currently sports a yield of 2.31%.
Lastly, the SPDR Russell 1000 Low Volatility Focus ETF (ONEV) is a relative newcomer in this arena. ONEV launched in December 2015 and is designed to select a subset of 420 U.S. large-cap holdings from the broader Russell 1000 Index. A fund of this nature may be appropriate for investors who favor a deeper index constructed according to similar principles as its more concentrated peers. In addition, ONEV charges an expense ratio of 0.20%, which is reasonable for its class.
Analyzing The Technical Picture – Aaron Jackson
USMV has masterfully done it’s job providing minimum volatility. The Funds’ top 5 holdings all sport a 2.9%+ dividend yield. Its structure has allowed investors to take advantage of the strength of defensive stock groups such as consumer staples and utilities while still being highly correlated to the S&P 500.
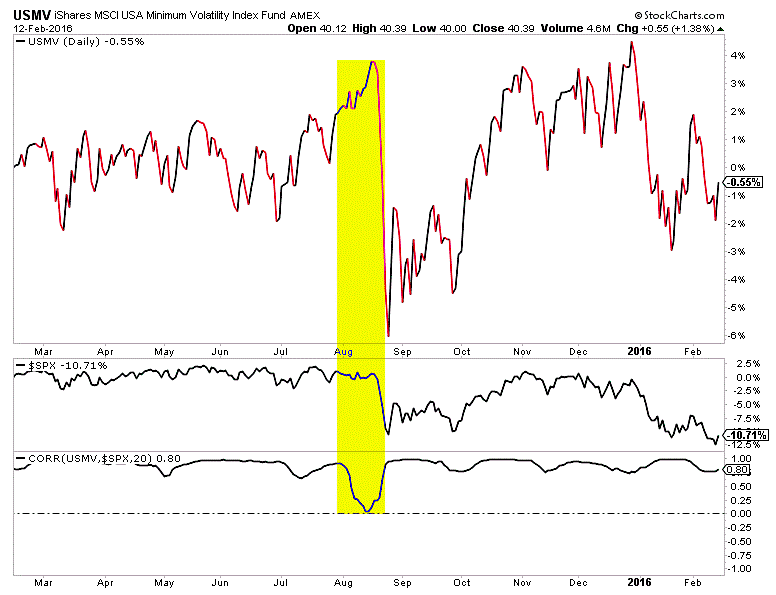
This low volatility ETF is flat over the past year while the S&P 500 is down 10%. Also note the sharp drop in correlation between USMV and the S&P 500 leading into August 2015’s sharp decline. That provided a nice footprint of flows into defensive assets.
Moving on to SPLV, this ETF is also made of stable businesses such as Campbell Soup (CPB), Coca Cola (KO), Clorox (CLX) and Verizon (VZ).
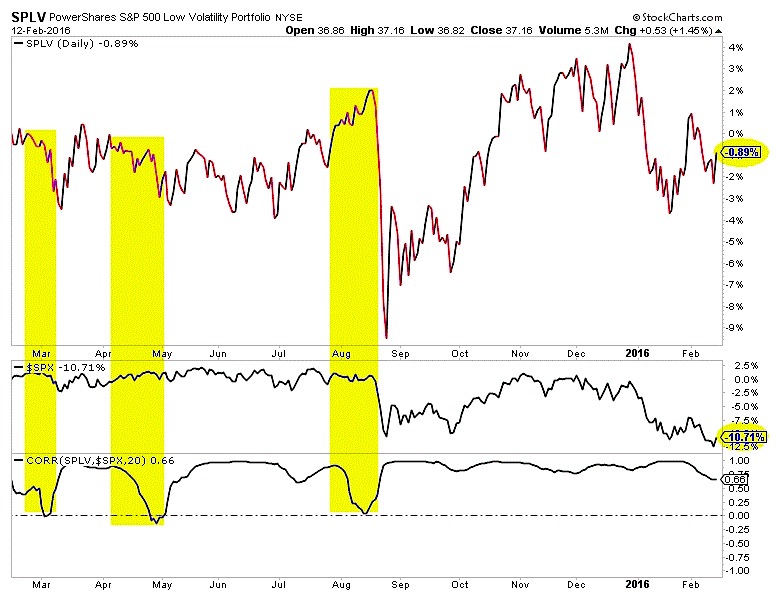
There are two interesting points worth noting on this chart. First, there are meaningful drops in the one month correlation from time to time, which show the start of a flight to safety in 2015. We also see that while the market has recently reached new lows, this index has positively diverged.
The technical differences across low volatility ETFs such as USMV and SPLV are hardly noticeable.
ONEV is drastically different than the other two.
Unlike SPLV and USMV, ONEV’s benchmark tracks an index made of a drastically larger number of stocks with greater risk qualities.
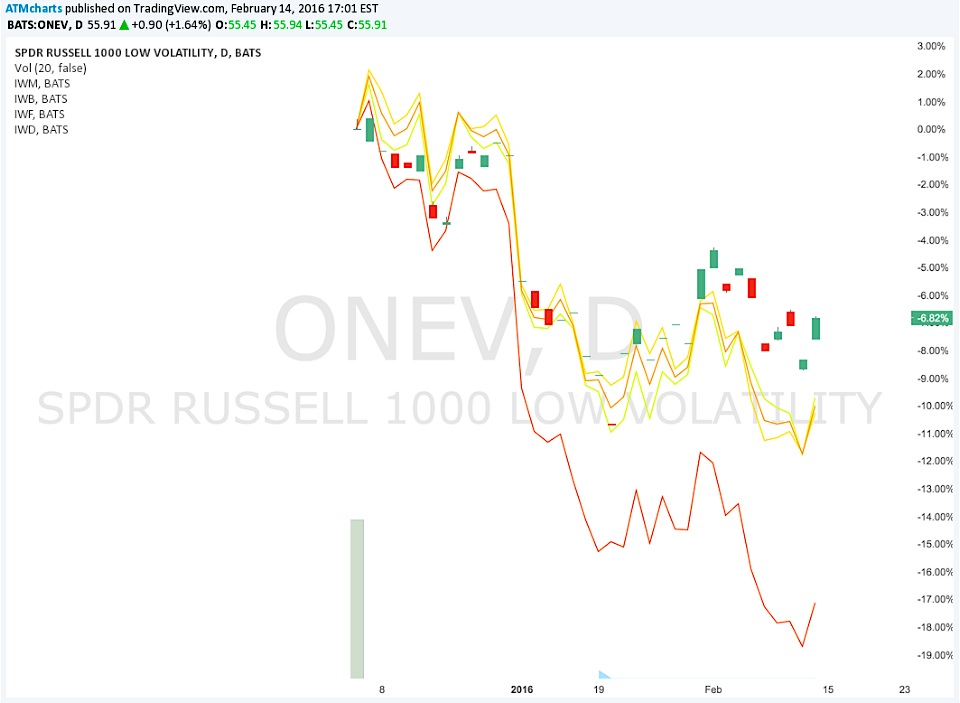
As you can see, ONEV is down 6.8% since inception while it’s Russell 1000 ETF cousins are down roughly 10%. In the same period, the S&P 500 is down 9%.
We must also note the complete lack of interest in this product to this point. ONEV is a defensive instrument within a non-defense stock index. It’s an unproven product and style doesn’t really fill a classic market objective.
Conclusions:
- USMV and SPLV have both proven to be suitable ways to be in stocks defensively.
- The greatest differentiators between the two funds is SPLV’s monthly dividend payments and .1% greater expense ratio
- ONEV is currently not liquid enough to be considered a suitable investment vehicle.
Thanks for reading!
Disclosure: At the time this article was written, David Fabian and clients of FMD Capital Management owned shares of USMV. The views expressed by Aaron Jackson are those of the independent author and are not affiliated with FMD Capital Management.
Twitter: @fabiancapital @ATMCharts
David Fabian and clients of FMD Capital Management owned shares of USMV at the time of publication. Any opinions expressed herein are solely those of the authors, and do not in any way represent the views or opinions of each other or any other person or entity.
 Rolling Over At Key Fibonacci Level?")


