 The US Dollar is currently trading at a very interesting level. The US Dollar 80 level has acted as a major pivot area in the past. It’s also been an area where the biggest swings have taken place. To illustrate this, let’s take a look at a few charts.
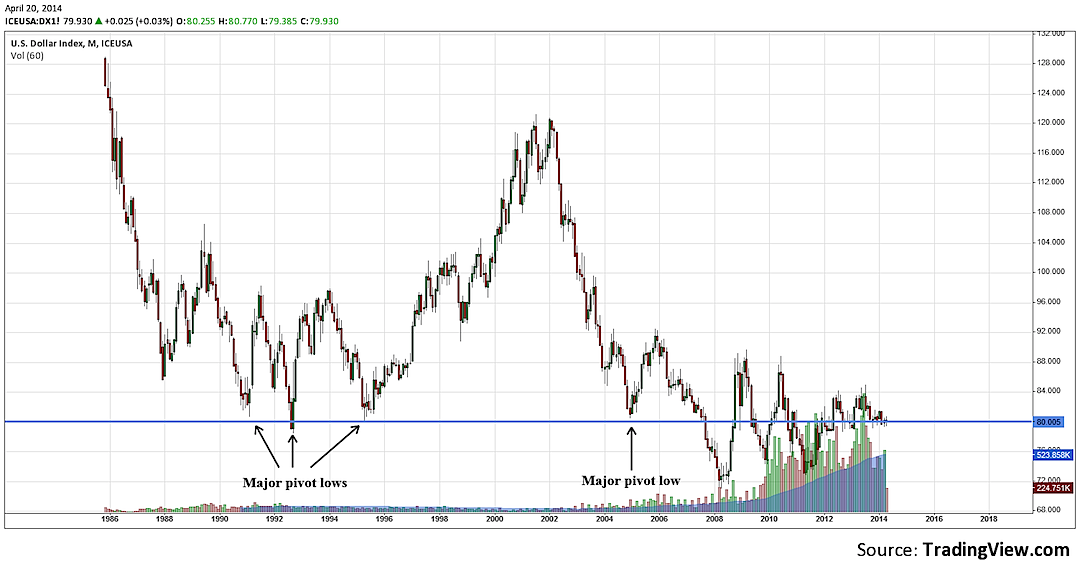
The first chart is a monthly chart that goes back to 1987. It shows that the US Dollar 80 level has acted as a pretty significant pivot area on 4 separate occasions.
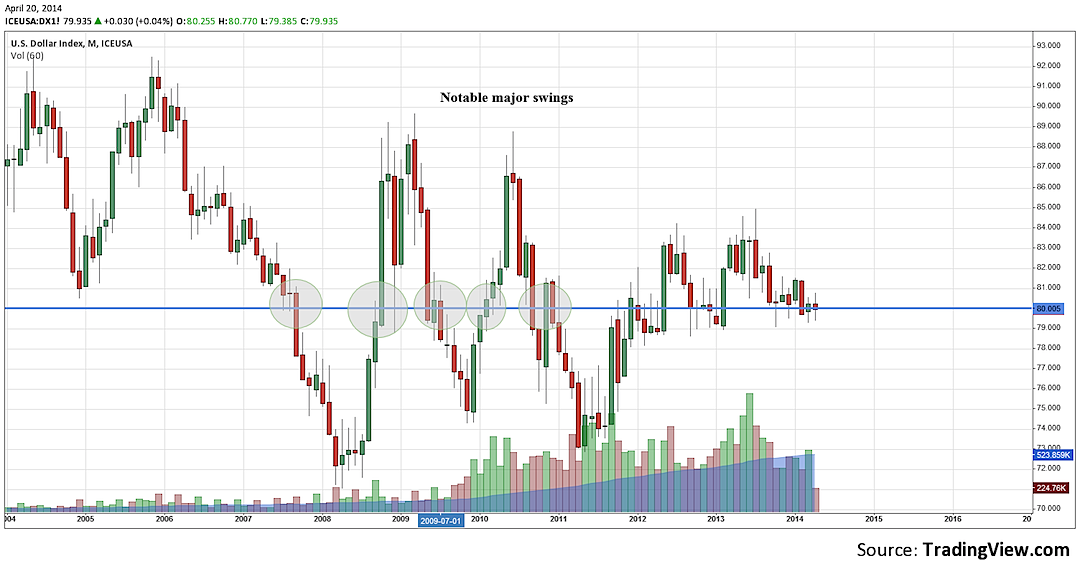
The second chart is a monthly chart that goes back to 2004. It shows that more recently, the US Dollar 80 level has been an area where wild swings have taken place.
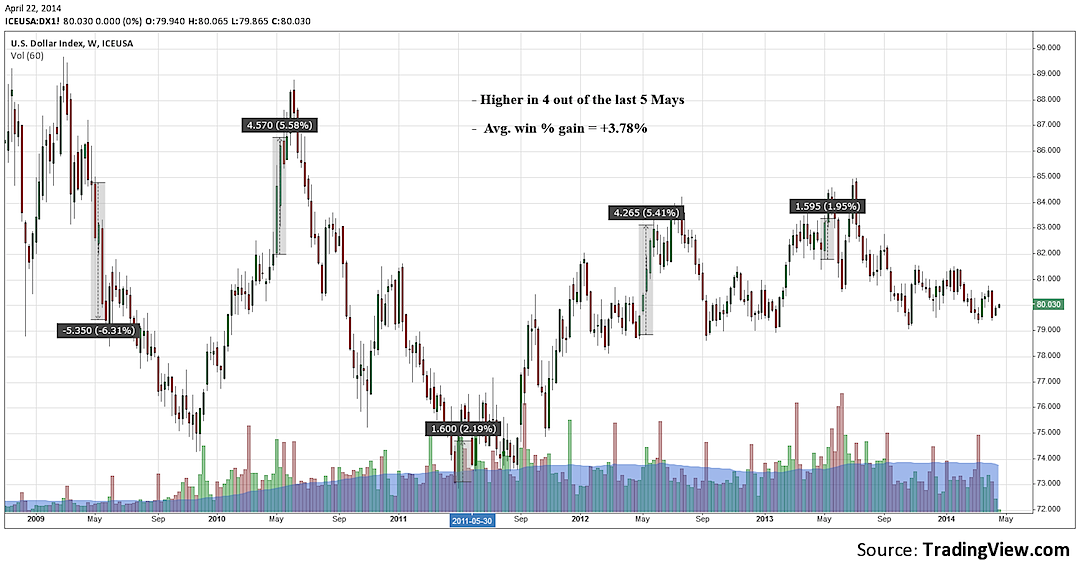
The final chart is a weekly chart that goes back to 2009. It shows that the US Dollar, recently, has showed positive seasonality trends in the month of May. It’s been higher in 4 out of the last 5 Mays, with an average win % of 3.78%.
So, will this 80 level be another major pivot low or will we continue to see wild swings through this level? Thank you for reading.
Author has a position in UUP in the money calls at the time of publication. Any opinions expressed herein are solely those of the author, and do not in any way represent the views or opinions of any other person or entity.

: Cup (and Maybe Handle) Watch")
 Trading Near Top Of Price Range")

