As traders close the book on 2017, it is time to start looking forward to 2018. What’s in store for the stock market next year?
To help answer this question, I put together a few quant studies. Heck, I even used holiday colors for the charts.
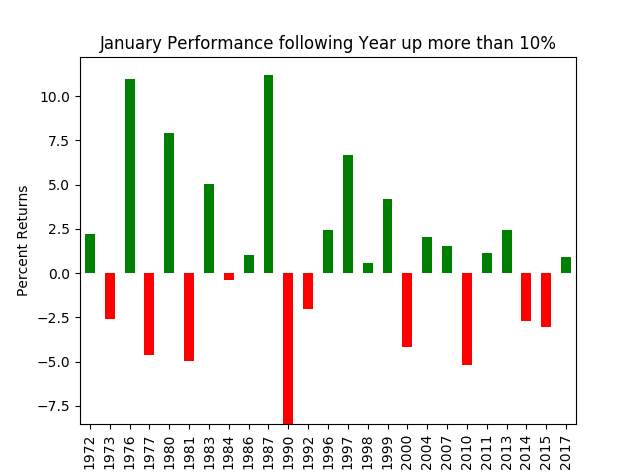
The first chart shows January’s S&P 500 performance following a year that was up at least 10% (which at the time of writing this 2017 should qualify). You can see that as of late, the January following a solid up year (+10% or more) has not been so stellar.
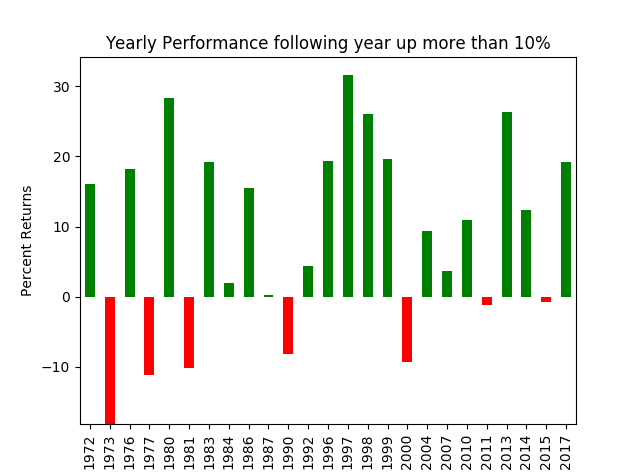
However, looking at the entire year following a solid up year for stocks (+10% or more) we can see that there has been a case of “momentum” and continuation in the following year. 14 of the following 25 qualifying years since 1970 have closed higher than 10%.
In other words, since 1970 56% of the years following a 10% or more year for the S&P 500 have also returned at least 10%. That bodes well for 2018 albeit not a very large sample.
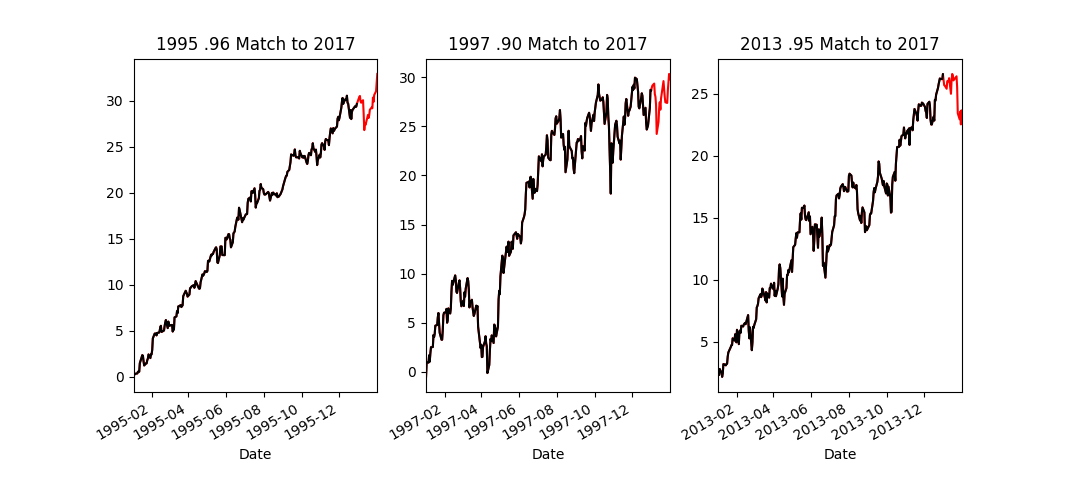
January stock market performance was a bit more interesting so I wanted to dive a little deeper. I ran a pattern matching search finding years that exhibited similar price paths to 2017; I found all the examples that qualified more than a “90% match”. Below you can see the matching years in black (1995, 1997, 2013) and how their following January (red) performed. All three of these years were followed by “rocky” Januarys.
Finally, I want to show some simple fourth quarter prediction bands and how they played out. These just use the rolling previous two quarters to attempt to forecast the upcoming quarter. These are naturally (and obviously) skewed to recent performance – which arguably should be given the most weight but this method is not without fault.
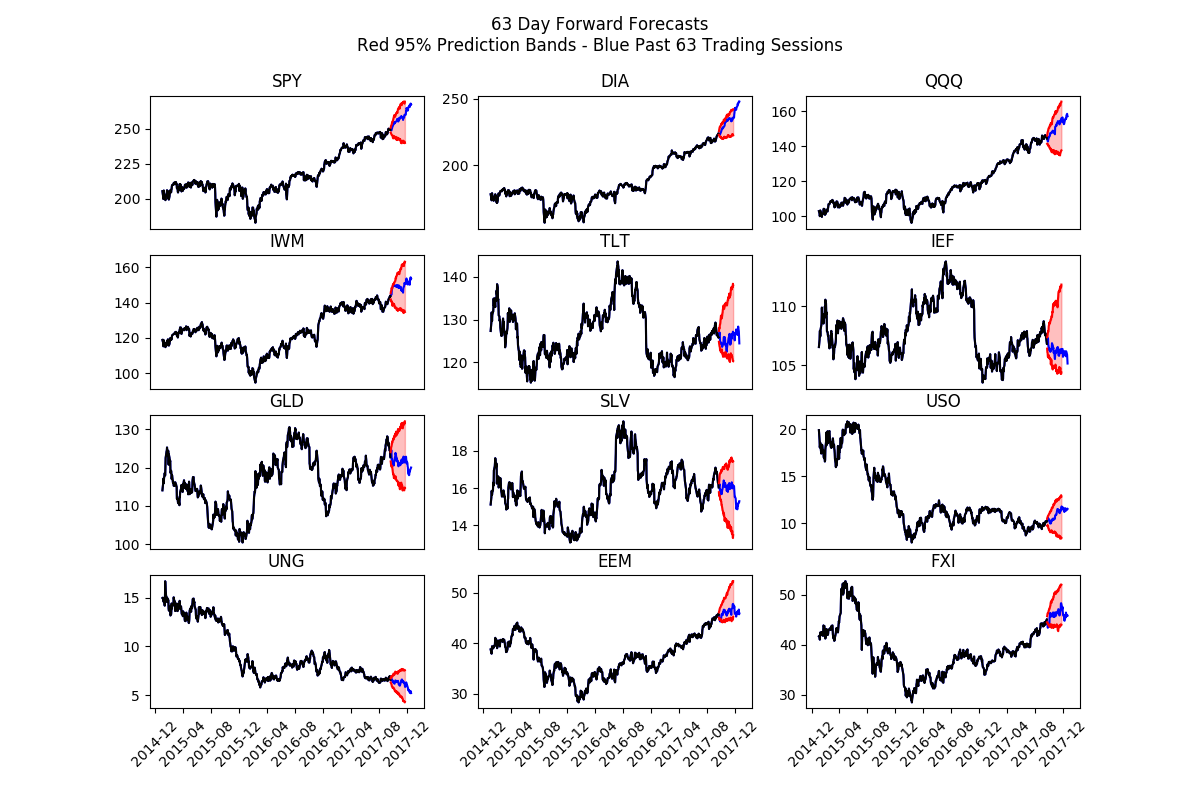
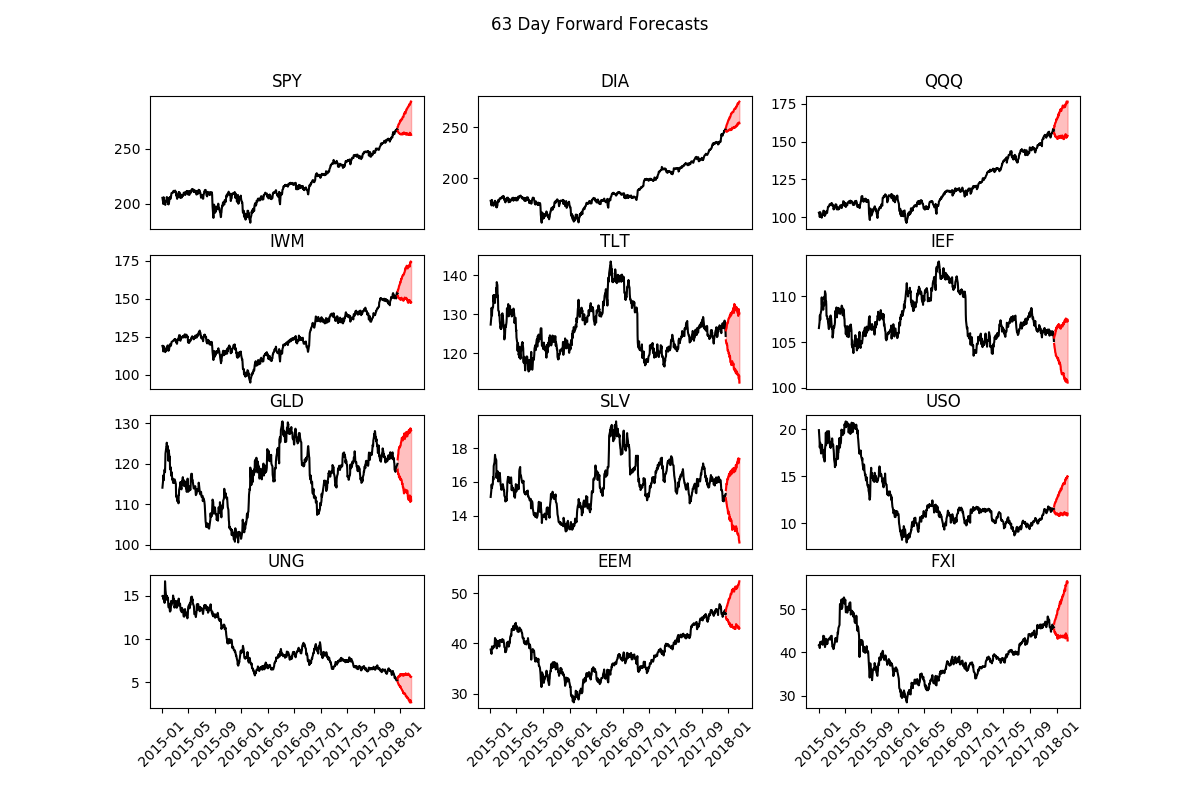
Finally, here is how the same method forecasts into 2018. These could be particularly useful for volatility sellers which it appears we all are nowadays!
Thanks for reading all year, supporting Build Alpha, and I look forward to contributing more next year. Wish you and yours a happy holiday season. Sometimes a little forced time off is just what a trader needs! See you next year.
Over at Build Alpha, I have tools that can help anyone, even those with no programming capabilities to do simple and complex testing. Thanks for reading.
Twitter: @DBurgh
No position in any of the mentioned securities at the time of publication. Any opinions expressed herein are solely those of the author, and do not in any way represent the views or opinions of any other person or entity.


