Tracking sector performance is one of the most important functions in my research and it is deeply imbedded into my broader macro work. Drilling down into sector specifics allows me my first peak under the hood to examine the overall health of the U.S. Equities market. It also helps me to locate the areas of the market that I want to focus my investment strategies from a long, short and just plain “stay away” perspective. Much of the sector analysis that I have seen in the past revolves purely on a relative strength comparison of sectors and leaves the price charts to take a back seat. For me (and others), I believe that looking at both charts instead of one in isolation provides a bit further insight. Especially for this task: A Sector Outlook For 2015.
I would like to wind down the year, not with a review of 2014, but a look ahead to 2015, which could be a critical year for equities investors. As this is intended to be a yearly outlook, the longer-term charts tend to drive my views as well as filter out some of the dust likely to be kicked up. Lastly, the use of sector ETFs just eases the implementation of any investment strategies one might seem fit. Let’s begin the sector outlook with technology.
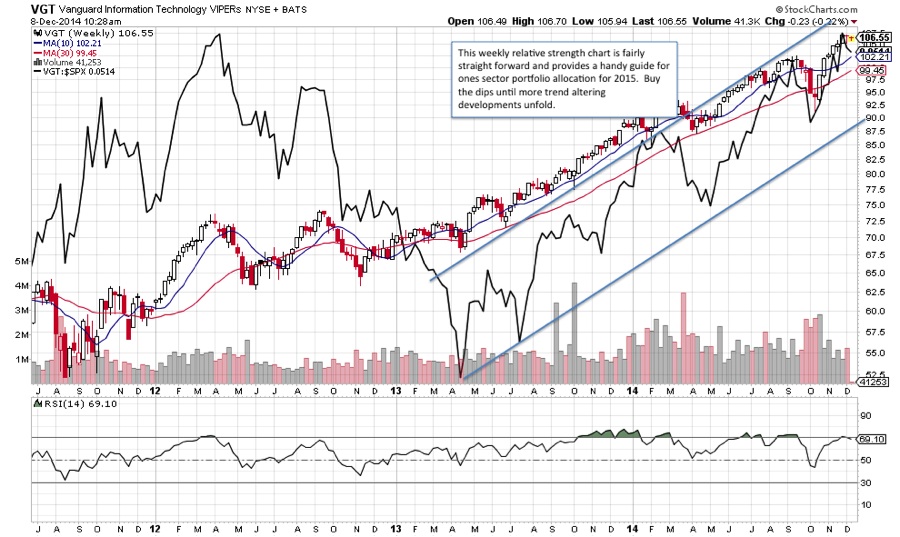
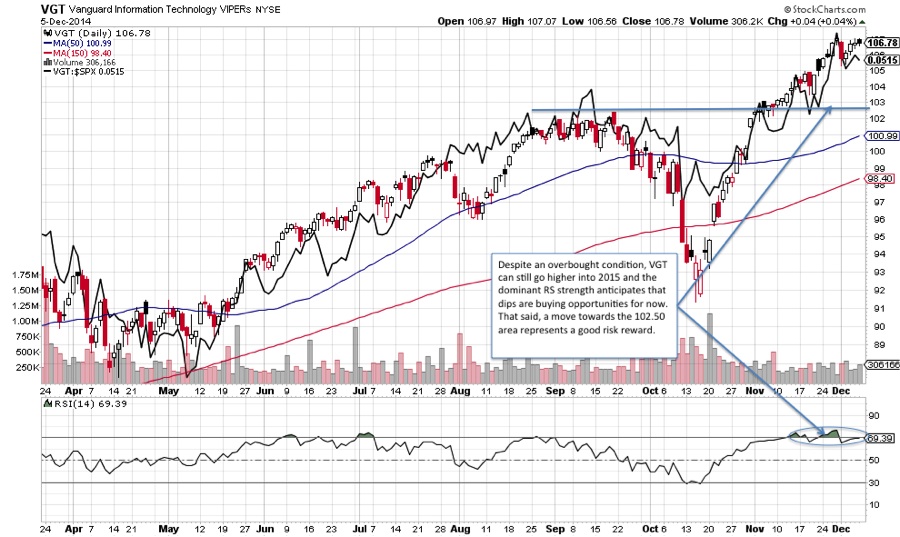
Information Technology Sector | Vanguard Information Technology ETF (VGT)
This weekly relative strength (RS) chart is fairly straightforward and provides a handy guide for ones sector portfolio allocation into 2015. While VGT trades within this broad 2-year uptrend channel, the intermediate term RS trend favors the most heavily weighted S&P 500 sector. A breakout above the channel further strengthens the relative importance of the sector, while a breakdown below the bottom of the range could imply a change in leadership and perhaps have a greater detrimental impact to US equities on the whole.
Given the extent of the run-up in many of the US sector ETFs over the past couple of months, a look at the daily charts will likely provide enough guideposts to manage our risks for the upcoming weeks and perhaps months to come. With that said, the first real key test to the downside to monitor looks to coincide with the September 2014 high and the Nov. 2014 breakout level near 102.42. Secondary support appears in the 99-101 area or the 50-day moving average (dma) and the 50% Fibonacci retracement of the October 2014 rally.
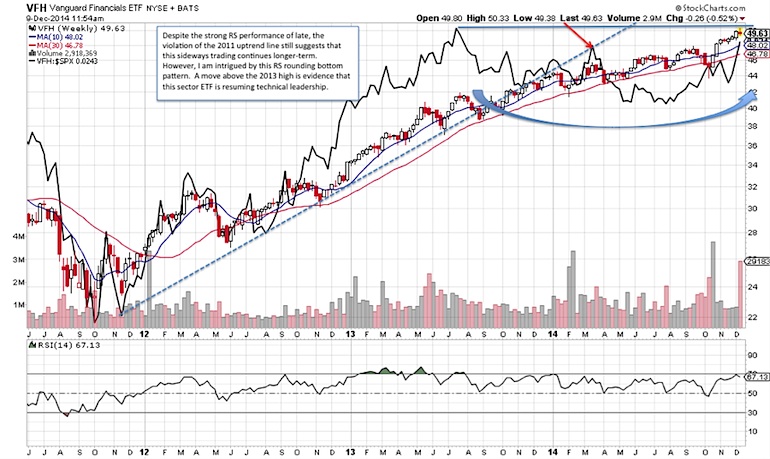
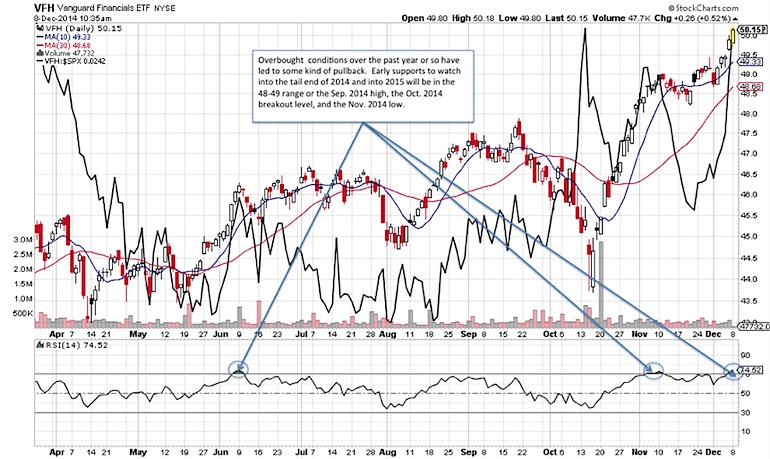
Financials Sector | Vanguard Information Financials ETF (VFH)
Despite the strong relative strength (RS) performance of late, the violation of the 2011 uptrend line still suggests that this sideways RS movement may continue for now. However, this RS rounding bottom pattern over the past year and a half intrigues me. A move above the 2013 high is evidence that this sector ETF is reemerging as a technical leader. A technical breakout could have bullish follow through well into 2015. Of note, there are other Financial sector ETF that looked poised to retest their respective 2013 RS highs ahead of VFH.
From a price perspective, continue to have an appropriate risk management strategy as an overbought condition and an early violation of its 2011 uptrend line suggest that one cannot invest blindly. Early supports to watch into the tail end of 2014 and into 2015 will be in the 48-49 range or the Sep. 2014 high, the October 2014 breakout level, and the November 2014 low. The ability to maintain this support on pullbacks could set the stage for the next rally higher.
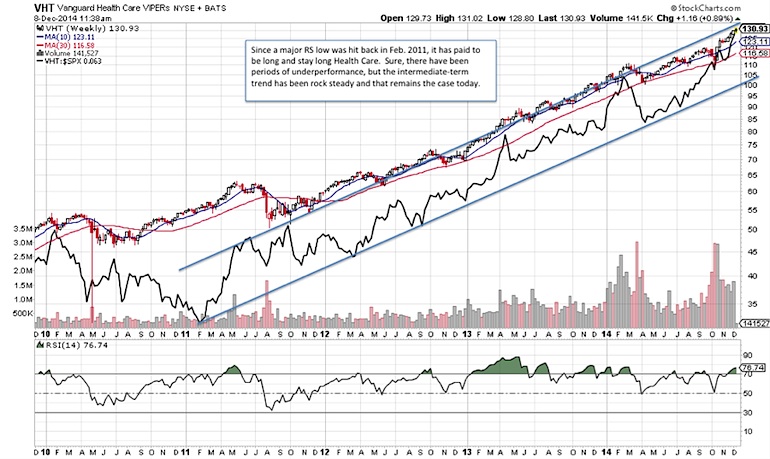
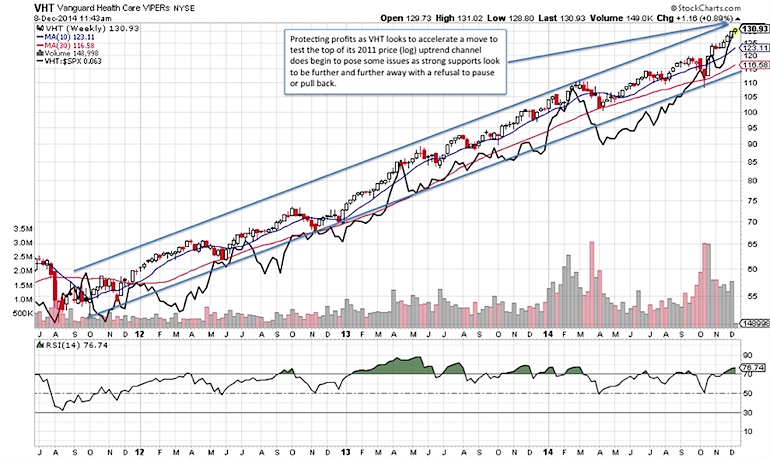
Health Care Sector | Vanguard Health Care ETF (VHT)
Since a major RS low was hit back in February 2011, it has paid to be long and stay long Health Care. Sure, there have been periods of underperformance, but the intermediate-term trend has been rock steady and that remains the case today. One thing perhaps that a tactical investor might have an eye on could be that VHT is now approaching the top of its 2011 relative strength uptrend channel. A breakout could accelerate the RS streak, but failure to breakout could open the door for some profit taking. However, it would take a breakdown below the bottom of the uptrend channel to seriously impact this longer-term relative strength call.
Protecting profits as VHT looks to accelerate a move to test the top of its 2011 price (log) uptrend channel does begin to pose some issues as strong supports look to be further and further away with its refusal to pause or pull back. Initial support is now near 120 or the Sep. 2014 high and the October 2014 breakout. The bottom of the trend channel closer to 115 represents key secondary support.
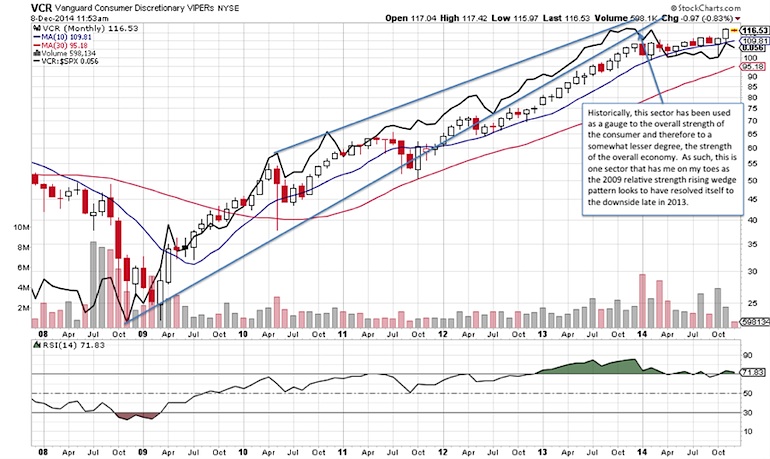
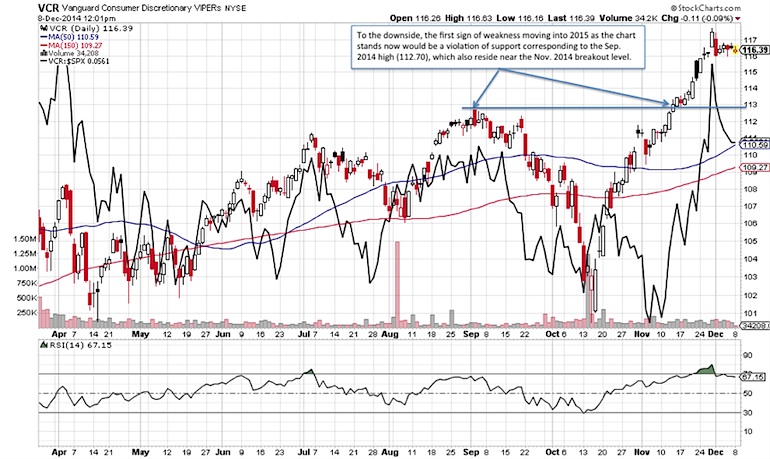
Consumer Discretionary Sector | Vanguard Consumer Discretionary ETF (VCR)
Historically, this sector has been used as a gauge to the overall strength of the consumer and therefore to a somewhat lesser degree, the strength of the overall economy. As such, this is one sector that has me on my toes as the 2009 relative strength rising wedge pattern looks to have resolved itself to the downside late in 2013. This has obviously not impacted the overall direction of the stock market yet, but that could be because the RS trend has been sideways has not turned down. That is why these April/September 2014 RS lows could play a crucial role, not only to the longer-term strength of this sector ETF, but perhaps the broader market in general. Until then, it appears likely that trading ranges will be the shorter-term plays.
To the downside, the first sign of weakness moving into 2015, as the chart stands now, would be a violation of support corresponding to the September 2014 high (112.70), which also resides near the November 2014 breakout level.
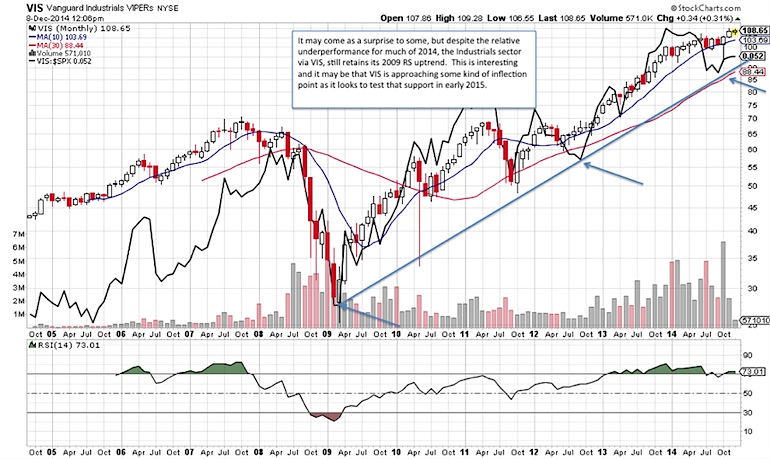
Industrials Sector | Vanguard Industrials ETF (VIS)
It may come as a surprise to some, but despite the relative underperformance for much of 2014, the Industrials sector via VIS, still retains its 2009 RS uptrend. This is interesting and it may be that VIS is approaching some kind of inflection point as it looks to test that support in early 2015. A violation of that support could be the beginning of a sustainable avoidance of the sector ETF versus other areas of the market. On the other hand, the ability to maintain this RS support could be the result of a sector rotation as VIS begins a period of outperformance.
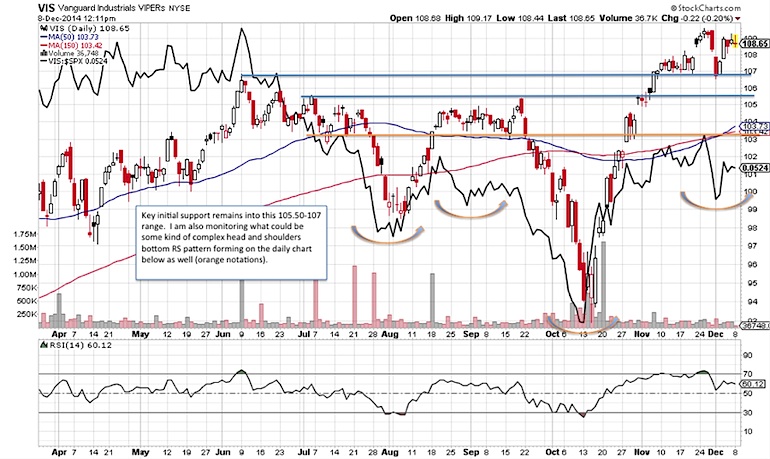
Key initial support remains into this 105.50-107 range. I am also monitoring what could be some kind of complex head and shoulders bottom RS pattern forming on the daily chart below as well (orange notations).
Consumer Staples Sector | Vanguard Consumer Staples ETF (VDC)
As the Consumer Discretionary sector is more sensitive to the strength and weakness of the consumer/economy, the Consumer Staples sector is by definition more defensive to such changes. Nonetheless, this sector ETF has historically become a favorite (relative outperformer) during times of uncertainty, while underperforming during times of economic recovery. Therefore any major shifts in the relative outperformance should be taken seriously as it could allude to a weakening stock market even if prices continue to rise.
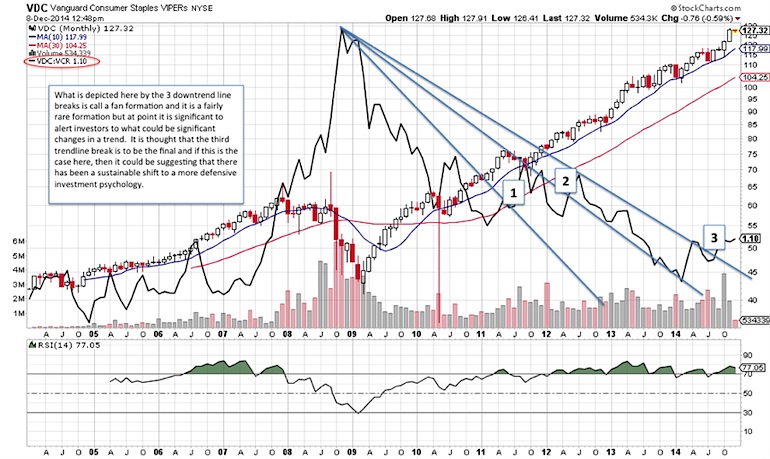
Note in the monthly chart below that the relative strength chart is not versus the S&P 500 like the other charts, but rather a relative strength study versus the consumer discretionary ETF (VCR) as I think that this is perhaps giving off some kind of warning signal. What is depicted here by the 3 downtrend line breaks is call a Fan formation and it is fairly rare, but at points it can be an alert to a significant change in trend. It is thought that the third trendline break is to be the final one and if this is the case here, then it could be suggesting that there has been a sustainable shift to a more defensive investment psychology. As this is a long-term chart that takes time to change and develop, then history will be the ultimate judge as to this pattern’s veracity.
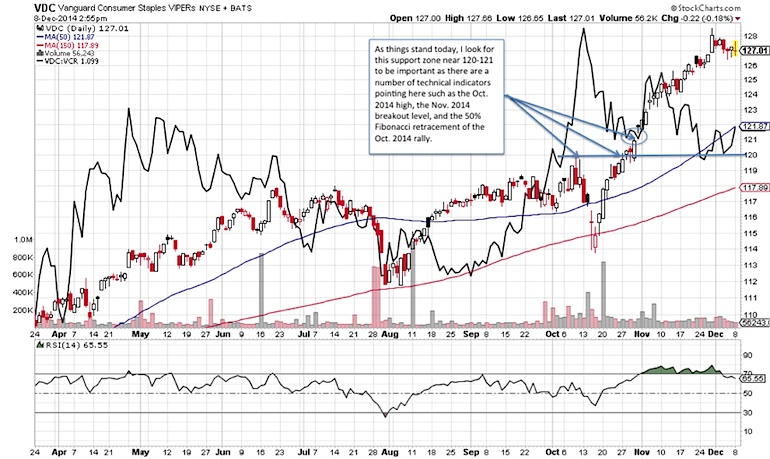
As things stand today, I look for this support zone near 120-121 to be important as there are a number of technical indicators pointing here such as the October 2014 high, the November 2014 breakout level, and the 50% Fibonacci retracement of the October 2014 rally.
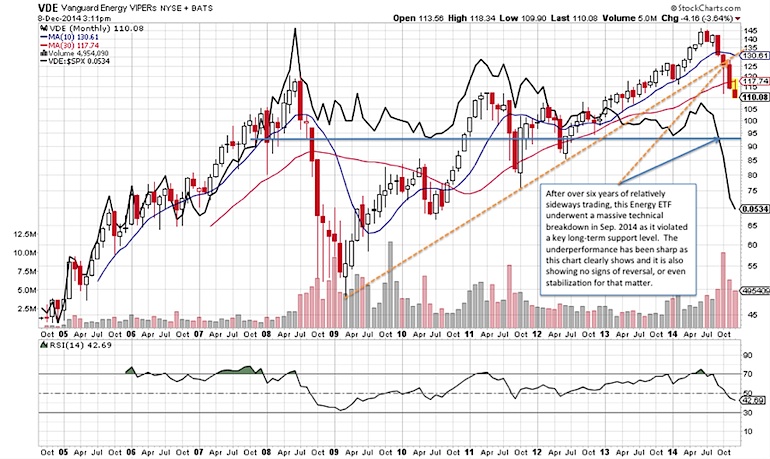
Energy Sector | Vanguard Energy ETF (VDE)
After over six years of relatively sideways trading, this Energy ETF underwent a massive technical breakdown in September 2014 as it violated a key long-term support level. The underperformance has been sharp as this chart clearly shows and it is also showing no signs of reversal, or even stabilization for that matter. From a price perspective, one can also see the violation of the major 2009 uptrend line. This is what one may refer to as some severe technical damage that needs to be repaired. In other words, there are a number of things that need to occur to make this a safe playground for investors. Traders may attempt to bottom fish for an oversold rally, but a disciplined style to ones risk management and profit expectations must be drafted before trades are place, in my opinion.
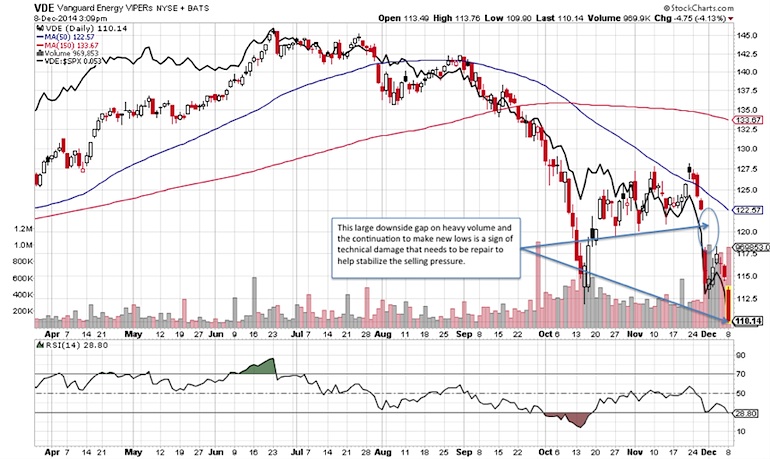
Below are some near-term signs of the technical damage that need to be repaired before the selling pressure is to stabilize.
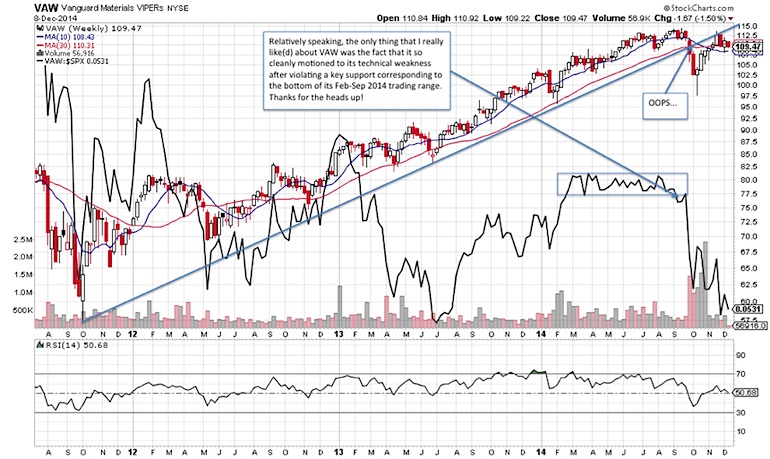
Materials Sector | Vanguard Materials ETF (VAW)
Relatively speaking, the only thing that I really like(d) about VAW was the fact that it so cleanly motioned to its technical weakness after violating a key support corresponding to the bottom of its February-September 2014 trading range. The September 2014 violation of its 2011 uptrend line and the subsequent cross of the 10-week ma below its 30-week ma add further weight to this sector ETF setting up to underperform in the year ahead.
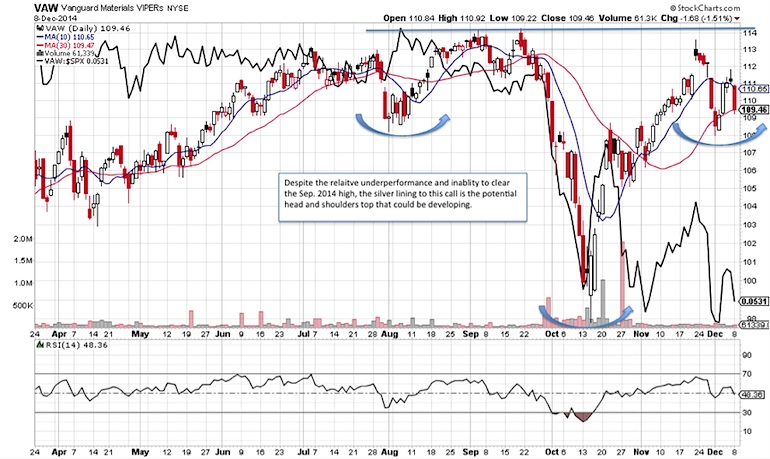
VAW is one of the few sector funds here that is still trading below its September 2014. Will VAW continue to lag? It appears that way, but the silver lining here is that there is a potential fairly significant head and shoulders bottom pattern that could be developing, which will need to be watched as the potential “game-changer”. Neckline resistance would be near the September 2014 high of 114.25. A convincing breakout along with a change in relative strength could indicate the emergence of new leadership. Until then, caution is still advised.
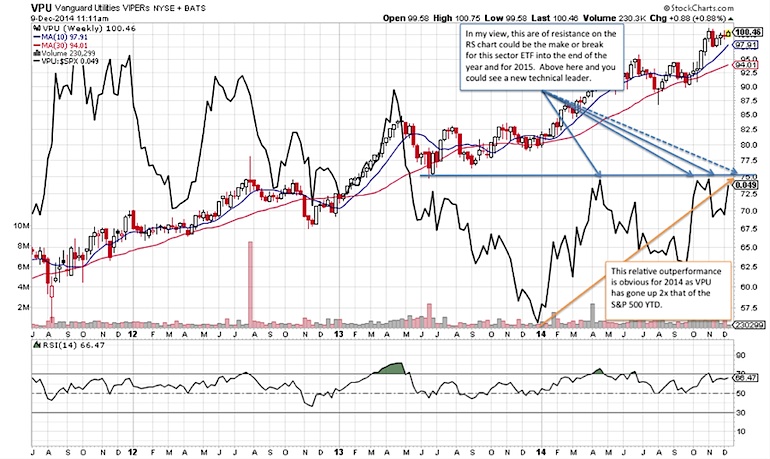
Utilities Sector | Vanguard Utilities ETF (VPU)
From a long-term relative strength perspective, VPU reached a major peak in early 2009 and has since trended slightly lower. With that it mind, it might come as some surprise that VPU has gained roughly two times that of the S&P 500 for 2014, gaining some 23.4% versus 11.5% YTD. The question now, is whether VPU is in for another strong year, relative to the S&P 500. Well, the daily chart is showing some signs of strength as the RS looks to be setting up for a test of a significant resistance corresponding to the April/October/November 2014 highs (see below). I believe that this level will be the test for 2015 and it could be a telling sign for some of the broader macro calls as well, or vice versa. For example, a breakout could open the door for VPU to become a leadership sector ETF, which may be a sign of investors putting on their defensive hats and hiding in this high dividend yielding area of the market. The other area of the market to watch will be the 10-year US Treasury Note Yield (TNX) as a breakout in VPU could coincide with what looks to be lower treasury yields on the horizon (for another post), in my opinion.
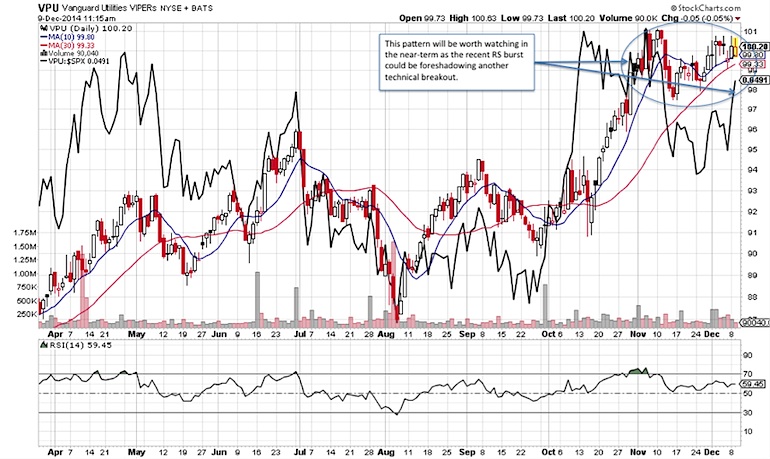
Relative strength is showing a bit of momentum recently and this could be a bit encouraging as this coincides with a somewhat positive looking technical pattern developing over the past month or so. A break above the November 2014 high coupled with increasing relative strength could lead to some favorable follow through into 2015.
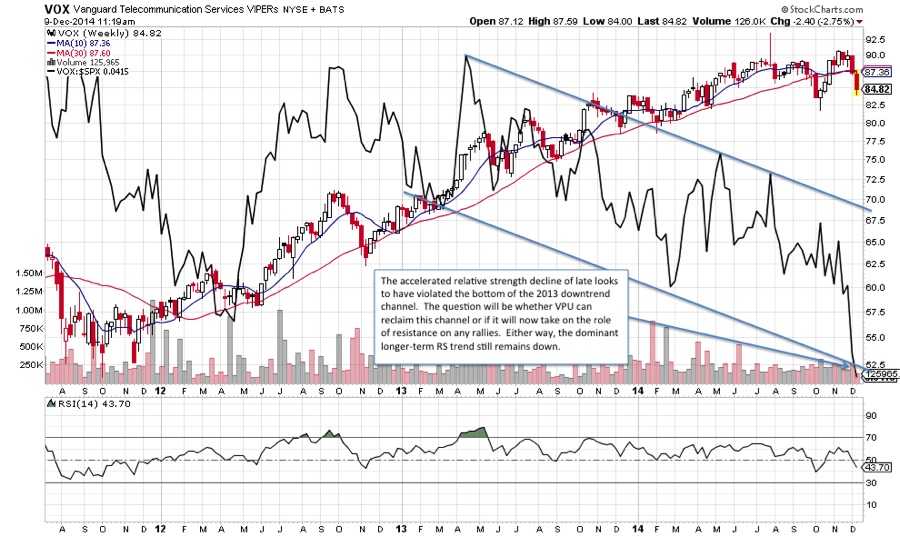
Telecom Sector | Vanguard Telecommunication Services ETF (VOX)
The Telecommunication Services Sector via VOX has steadily underperformed the overall market over the past two years or so, but the recent sharp decline could prove to be quite damaging as it has broken through the bottom of its 2-year downtrend channel. There are now a couple of things likely to happen in my view, at least from a relative strength perspective. The first is that the underperformance continues or even accelerates near-term; or secondly it sees some reprieve to retest the bottom of the channel. This will be a key near-term test as failure to reclaim this channel could set the stage for another downdraft. On the other hand a push back into the channel could alleviate some of the pressure, but bear in mind that the dominant relative trend remains down and is likely to continue into 2015, in my view.
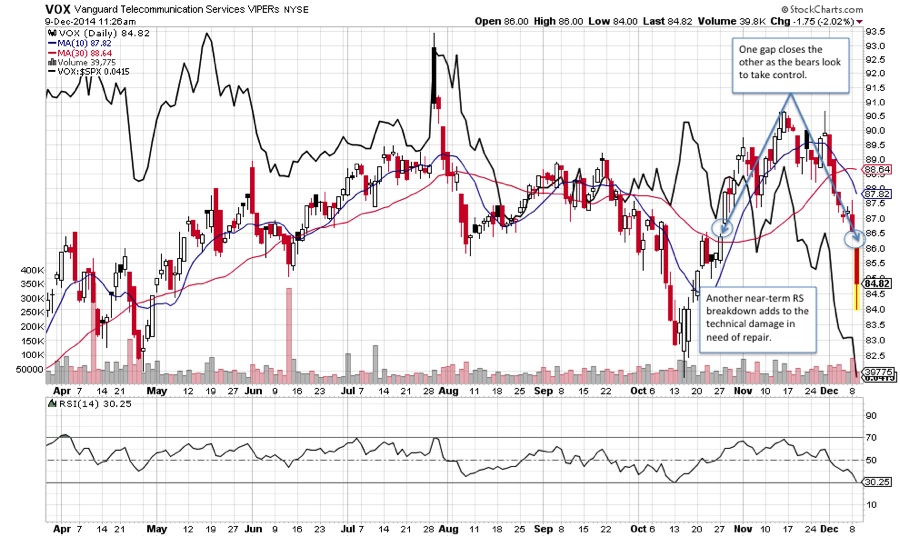
The daily chart below depicts the recent technical breakdowns in terms of both price and relative strength. Note the 12/9/14 downside gap and how it closed the 10/28/14 upside gap in strong fashion. The top of this gap at 86.57 will now act as near-term resistance, while the October 2014 low of 81.79 should play a key role as downside support.
To conclude, sector rotation occurs and rising and falling leaders will emerge and disappear, but until the dominant technical trends that I have highlighted here show signs of failing I will remain a believer that the trend will resume in a timely fashion. Should signs of technical weakness/strength change the charts enough to alter my outlook, well, then my outlook will alter as necessary. The beauty of technical analysis!
Follow Jonathan on Twitter: @jbeckinvest
No position in any of the mentioned securities at the time of publication. Any opinions expressed herein are solely those of the author, and do not in any way represent the views or opinions of any other person or entity.


