One of the most important functions in my research is tracking sector performance. It is deeply imbedded into my broader macro work, as drilling down into each sector allows me to gauge the overall health of the U.S. Equities market. It also assists me in locating areas of the market that I want to focus my investment strategies on. For more on my approach and to read my other 2015 sector outlook posts, click here.
This post will focus on the Health Care Sector and Utilities Sector. As this is intended to provide a yearly outlook, the longer-term charts will drive my views as well as filter out some of the near-term noise. Lastly, the use of sector ETFs eases the implementation of any investment strategies one might see fit. Note the Health Care and Utilities sectors can also be tracked and traded via Health Care Sector SPDR (XLV) and Utilities Sector SPDR (XLU).
Health Care Sector – Vanguard Health Care ETF (VHT)
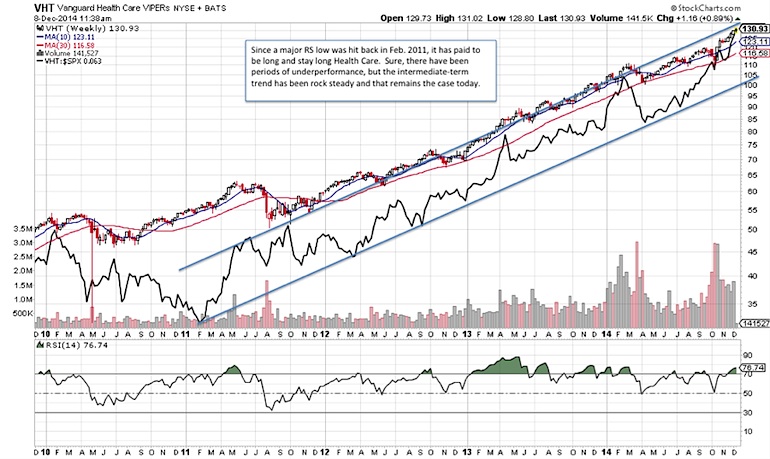
Since a major Relative Strength (RS) low was hit back in Feb. 2011, it has paid to be long and stay long Health Care. Sure, there have been periods of underperformance, but the intermediate-term trend has been rock steady and that remains the case today.
One thing perhaps that a tactical investor might have an eye on could be that VHT is now approaching the top of its 2011 relative strength uptrend channel. A breakout could accelerate the RS streak, but failure to breakout could open the door for some profit taking. However, it would take a breakdown below the bottom of the uptrend channel to seriously impact this longer-term relative strength call.
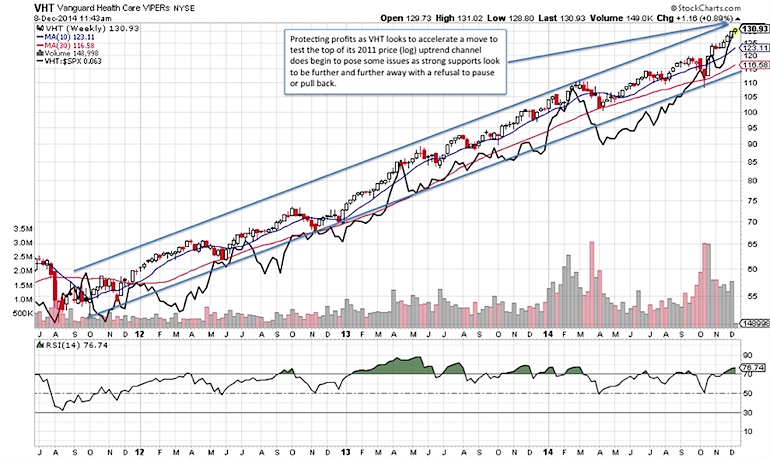
Protecting profits as VHT looks to accelerate a move to test the top of its 2011 price (log) uptrend channel does begin to pose some issues as strong supports look to be further and further away with its refusal to pause or pull back. Initial support is now near 120 or the Sep. 2014 high and the Oct. 2014 breakout. The bottom of the trend channel closer to 115 represents key secondary support.
Utilities Sector – Vanguard Utilities ETF (VPU)
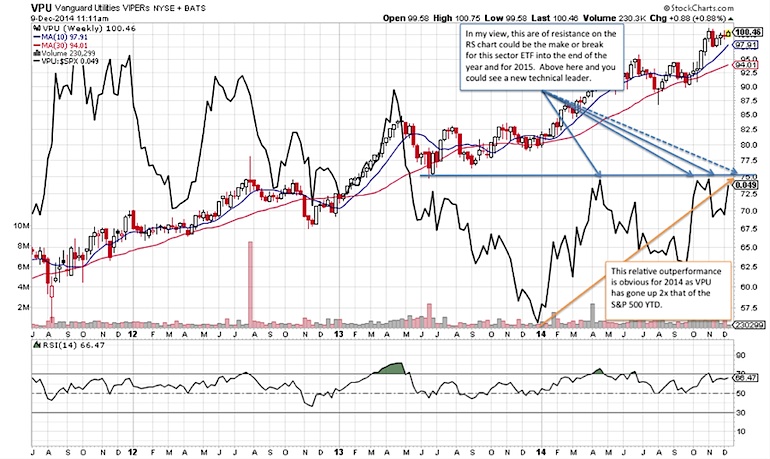
From a long-term relative strength perspective, VPU reached a major peak in early 2009 and has since trended slightly lower. With that it mind, it might come as some surprise that VPU has gained roughly two times that of the S&P 500 for 2014, gaining some 23.4% versus 11.5% YTD. The question now, is whether VPU is in for another strong year, relative to the S&P 500. Well, the daily chart is showing some signs of strength as the RS looks to be setting up for a test of a significant resistance corresponding to the Apr/Oct/Nov 2014 highs (see below). I believe that this level will be the test for 2015 and it could be a telling sign for some of the broader macro calls as well, or vice versa. For example, a breakout could open the door for VPU to become a leadership sector ETF, which may be a sign of investors putting on their defensive hats and hiding in this high dividend yielding area of the market. The other area of the market to watch will be the 10-year US Treasury market (Quote – TNX) as a breakout in VPU could coincide with what looks to be lower treasury yields on the horizon (for another post), in my opinion.
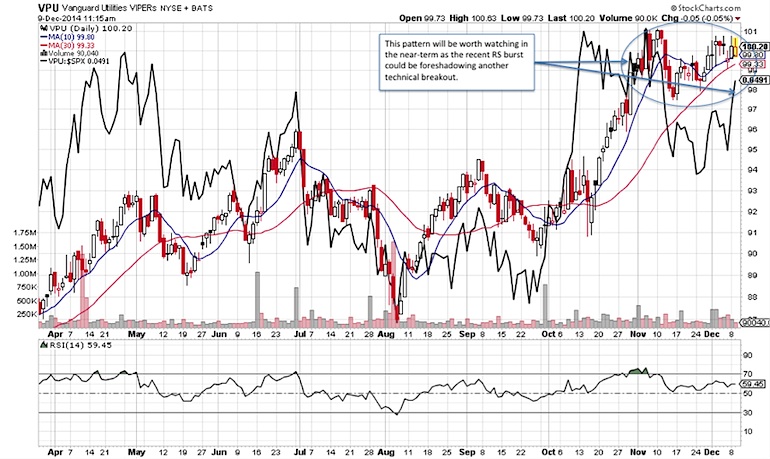
Relative strength is showing a bit of momentum recently and this could be a bit encouraging as this coincides with a somewhat positive looking technical pattern developing over the past month or so. A break above the Nov. 2014 high coupled with increasing relative strength could lead to some favorable follow through into 2015.
To conclude, I’d like to remind you that sector rotation is something that occurs and we should be mindful of. As well, rising and falling leaders will emerge and disappear, but until the dominant technical trends that I have highlighted here show signs of failing I will remain a believer that the trend will resume in a timely fashion. Should signs of technical weakness/strength change the charts enough to alter my outlook, well, then my outlook will alter as necessary. That’s the beauty of technical analysis! Thanks for reading.
Follow Jonathan on Twitter: @jbeckinvest
No position in any of the mentioned securities at the time of publication. Any opinions expressed herein are solely those of the author, and do not in any way represent the views or opinions of any other person or entity.


