The Federal Reserve has paused its interest rate hikes and inflation data seems to be leveling off. We’ll see.
All in all, bond yields (interest rates) are pulling back and investors are hopeful that we have a soft landing.
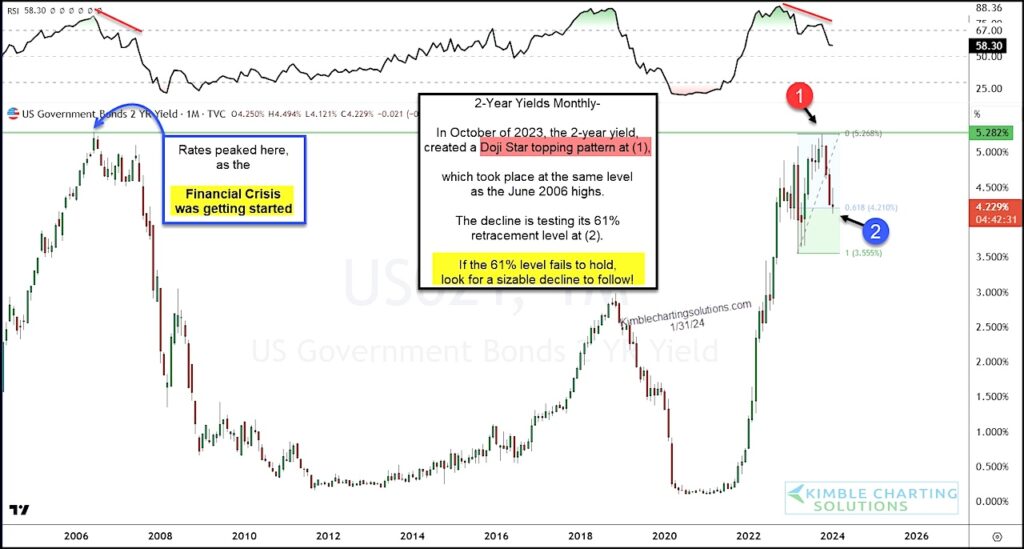
Looking at today’s long-term “monthly” chart of the 2-year treasury bond yield, it’s important to note that short-term interest rates are nearing an important decision point.
Very similar to 2006, the 2-year yield topped at (1) with an RSI divergence. So I humbly ask: Are 2-year yields following the pattern of the 2006 top?
Could this be a double top 18-years later?
The current decline has taken 2-year yields to 61% Fibonacci support level at (2). If the 61% Fib fail to hold then look for a sizable decline to follow! Stay tuned!
2-Year Treasury Bond Yields “monthly” Chart
Note that KimbleCharting is offering a 2 week Free trial to See It Market readers. Just send me an email to services@kimblechartingsolutions.com for details to get set up.
Twitter: @KimbleCharting
The author may have a position in mentioned securities. Any opinions expressed herein are solely those of the author, and do not in any way represent the views or opinions of any other person or entity.


