It is fair to say that the stock market has been lead higher by technology stocks and large cap stocks, in general.
But two stock market indices that historically have been key to broad market rallies have under-performed: the small cap Russell 2000 Index and the broad based Value Line Geometric Composite.
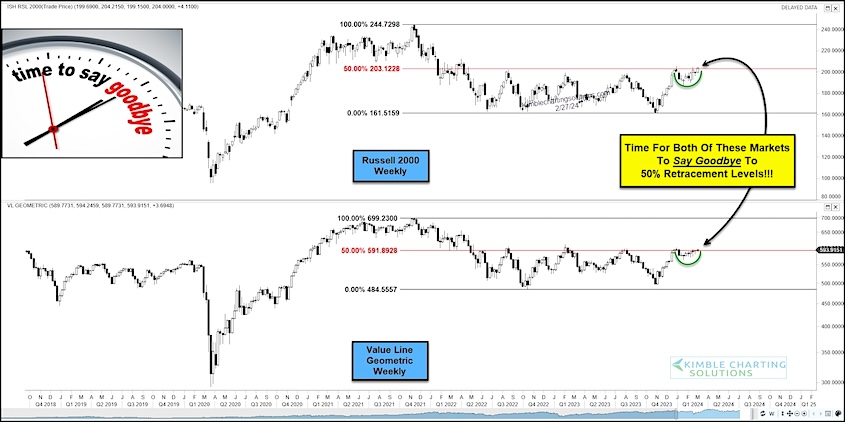
That said, both are trading at key breakout resistance levels as today’s “weekly” chart 2-pack shows.
As you can see, both indices are testing the 50% fibonacci retracement level.
A breakout would be bullish for these indices (as well as the broader market), while continued trade below these levels would indicate lagging performance.
Looks like it might be time to say goodbye to these levels, one way or the other! Stay tuned!
Chart 2-Pack: Russell 2000 and Value Line Geometric
Note that KimbleCharting is offering a 2 week Free trial to See It Market readers. Just send me an email to services@kimblechartingsolutions.com for details to get set up.
Twitter: @KimbleCharting
The author may have a position in mentioned securities. Any opinions expressed herein are solely those of the author, and do not in any way represent the views or opinions of any other person or entity.


