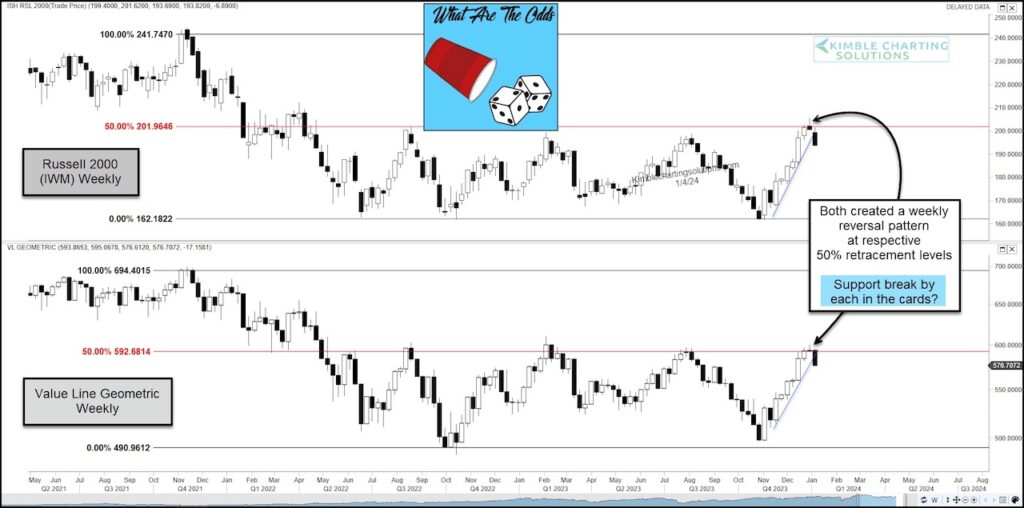
For the past two years, the Russell 2000 and Value Line Geometric Indexes have been lagging.
Recently, however, both have come alive… adding a tailwind to the end of year rally.
BUT these short-term rallies may be in trouble. Which also could mean that the broad market rally is in trouble.
As you can see in today’s chart 2-pack, both of these lagging indices peaked at the respective 50% Fibonacci retracement level over the past two years. And it could be happening again.
Note that each index created a weekly reversal pattern over the past 2 weeks and are attempting to break down through up-trend support. Worth watching here, in my opinion. Stay tuned!
Russell 2000 and Value Line Geometric Indexes Chart
Note that KimbleCharting is offering a 2 week Free trial to See It Market readers. Just send me an email to services@kimblechartingsolutions.com for details to get set up.
Twitter: @KimbleCharting
Any opinions expressed herein are solely those of the author, and do not in any way represent the views or opinions of any other person or entity.

: Cup (and Maybe Handle) Watch")
 Trading Near Top Of Price Range")

