Heading into this week, it was seen as “more” probable that strength in Technology and Industrial stocks would carry stocks higher despite the increasing volatilty seen in the FX and interest rates markets.
Yet this volatlity seemed to have spread much quicker than anticipated to the US, and has caused US Treasury yields to fall dramatically down to 2.78%.
This is a very low level considering that treasury yields just touched 3.11% roughly two weeks ago. This spill has become a leading indicator short-term as the markets have followed along…
Thus, watching Treasury Yields will be important in the days ahead. The US 10-year treasury yields have led Financials and also led the stock market lower as a whole.
The 10 year snapped back a bit, but the trend remain quite negative for yields in the short run.
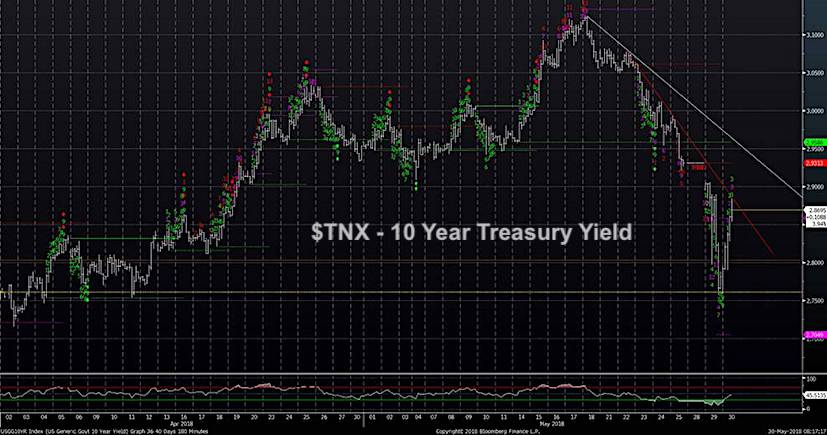
Given the lack of any signals at yesterday’s lows on the 10-Year yield, it is likely that this bounce will fail between 2.86 and 2.89… with a max near 2.91 before turning back down. I’m targeting 2.60 in the next 1-2 weeks.
US 10-Year Treasury Yield Chart
If you have an interest in seeing timely intra-day market updates on my private twitter feed, please follow @NewtonAdvisors. Also, feel free to send me an email at info@newtonadvisor.com regarding how my Technical work can add alpha to your portfolio management process.
Twitter: @MarkNewtonCMT
Author has positions in mentioned securities at the time of publication. Any opinions expressed herein are solely those of the author, and do not in any way represent the views or opinions of any other person or entity.


