The 10-year treasury bond yield is very closely watched by banks, consumers, and active investors. It is used as a measuring stick for interest rates on loans, bond auctions, etc.
When the 10-year treasury bond yield goes higher, so do interest rates on mortgages, personal loans, and car loans. And the government pays higher interest on some of its treasury-bill auctions.
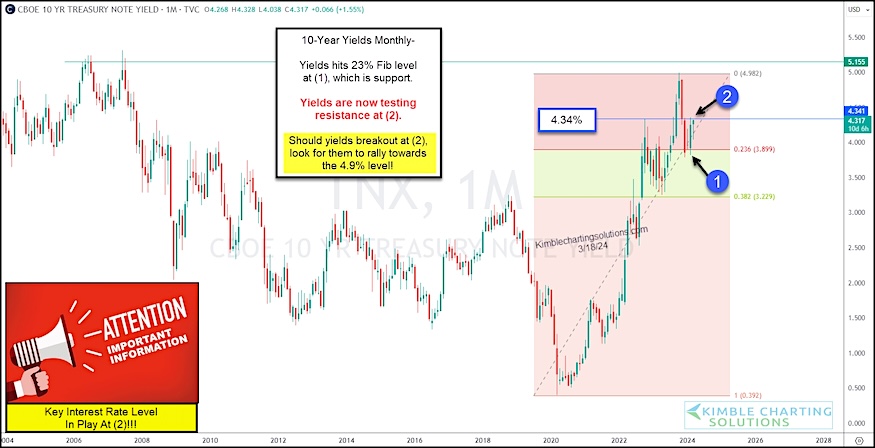
Today we look at a “monthly” chart of the 10-year treasury bond yield and highlight a key price resistance level that may dictate the next move for interest rates.
As you can see, the 10-year bond yield bounced off the 23.6 Fibonacci level at (1) and is testing a key resistance level – its prior highs – at (2).
Should the 10-year bond yield breakout at (2), look for it to rally to the 4.9% level.
Time to worry again about rising interest rates? Stay tuned!
10-Year Treasury Bond Yields “monthly” Chart
Note that KimbleCharting is offering a 2 week Free trial to See It Market readers. Just send me an email to services@kimblechartingsolutions.com for details to get set up.
Twitter: @KimbleCharting
The author may have a position in mentioned securities. Any opinions expressed herein are solely those of the author, and do not in any way represent the views or opinions of any other person or entity.


: Important Breakout Retest")


