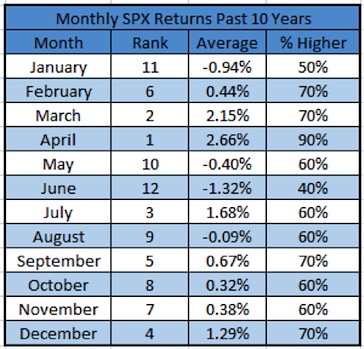
Welcome to June, hard to believe it is here already. As you’ve probably heard by now, June is the worst month for stocks of the year going back the past decade – down 1.32% on average. It is also the only month to gain just four times over the past 10 years.
Note that market returns are based on the S&P 500 Index (SPX).
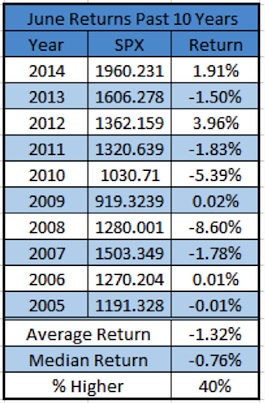
Here is what the past 10 years of stock market returns looks like for the month of June. Worth noting two of the past three years it is in the green with some nice gains.
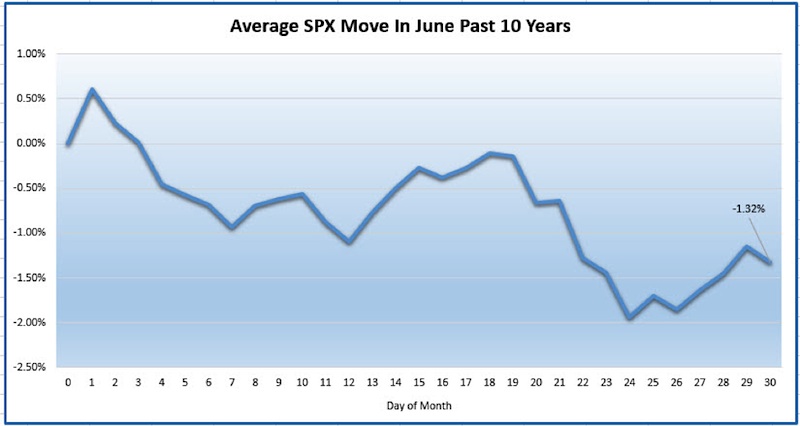
Here’s a chart of what the average June has looked like over the past 10 years on the S&P 500 (SPX). Starts off strong, only to trend lower the rest of the month.
Here is a breakdown of how often a trading day is higher.
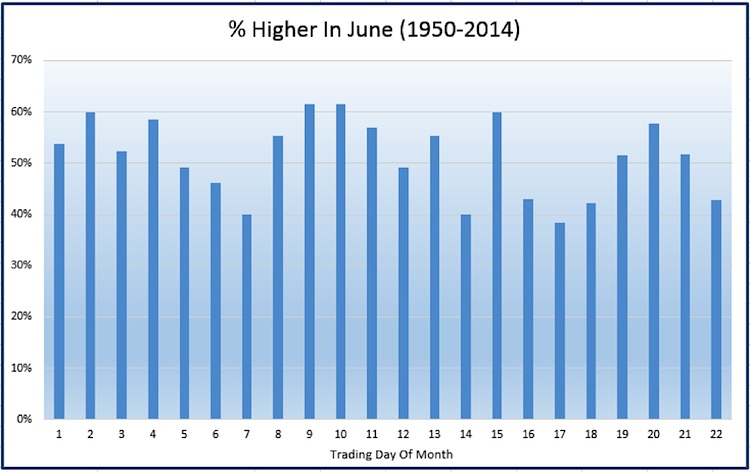
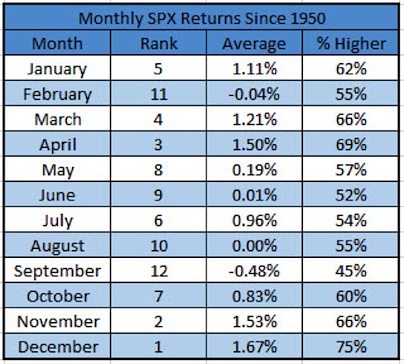
So June has been weak lately, but what about going out further? Well, we see similar results. Since 1950, it is up 0.01% on average and up 52% of the time. Both of these put it near the worst month for stocks by performance metrics.
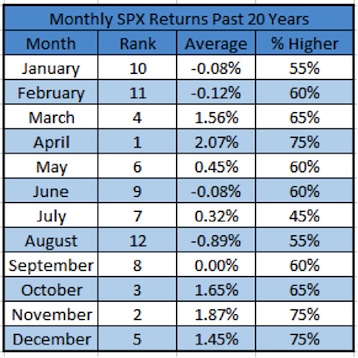
The past 20 years we see similar weakness in June.
Now remember, May was up this year. Think back to last year, May and June both gained. Should June finish higher this year, it would mean May and June will both be higher two straight years. We haven’t seen that since 2003/2004. Not the worst two years to be bullish.
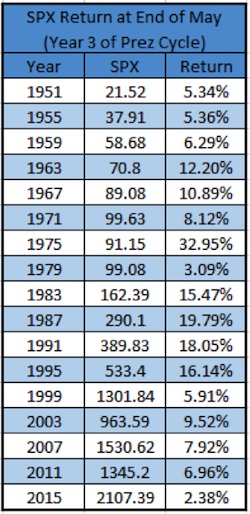
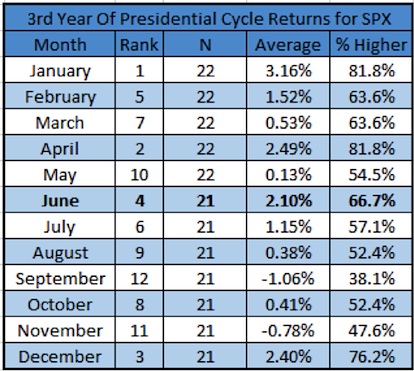
No seasonality conversation is complete without a break-down of the Presidential cycle. Remember, this is the 3rd year of the 4-year cycle. As of the end of May, the S&P 500 was up just +2.38% for the year. This is actually the weakest start to a 3rd year of the Presidential cycle going back to 1950.
Here’s what the average year 3 looks like compared with 2015 so far.
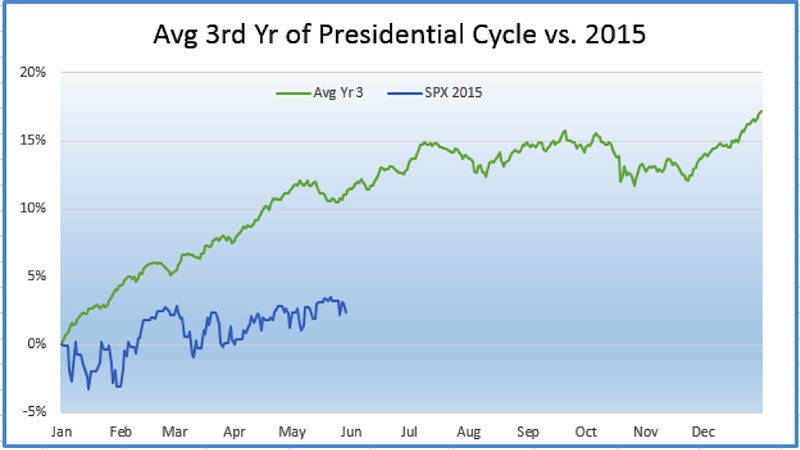
So is something wrong with 2015? This is usually a very bullish year based on the Presidential cycle and it can’t seem to get anything going in 2015. Does this mean the usually ‘weak’ summer months could be even worse? I don’t know, but I do think about this constantly.
I’ll leave you with this. Going back to 1928, June is actually pretty strong during the 3rd year of the Presidential cycle. Up more than 2% is very solid.
Thanks for reading and good luck out there.
Twitter: @RyanDetrick
No position in any of the mentioned securities at the time of publication. Any opinions expressed herein are solely those of the author, and do not in any way represent the views or opinions of any other person or entity.


")


")
 Rolling Over At Key Fibonacci Level?")