Welcome to July, the month that has seen the highest average VIX return out of the entire year. Honestly, I first noticed this last year and was surprised by it. You’d think the dog days of summer are boring, but July is anything but that.
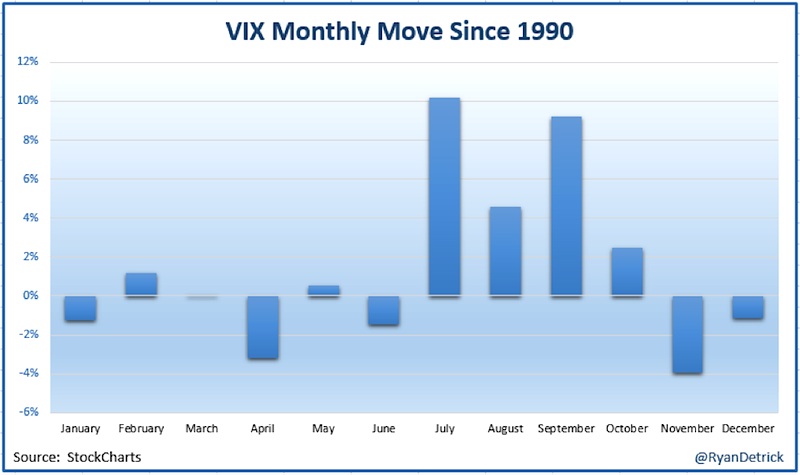
Here is what the Volatility Index (VIX) has done the past 25 years. As you can see, July is up just over 10% on average – making it the highest monthly return.
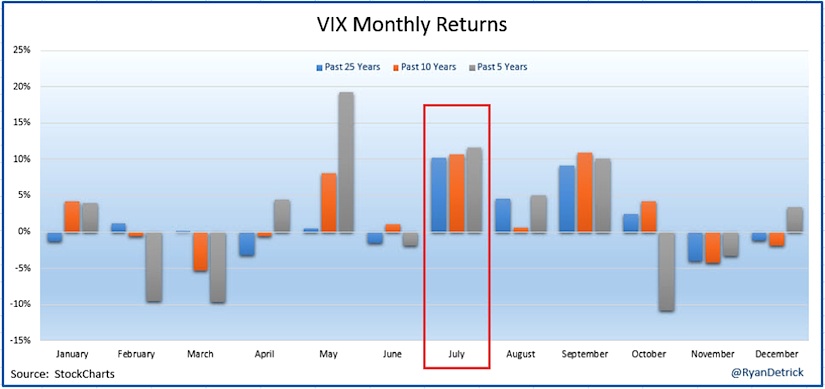
What about more recent action? Here are VIX monthly returns broken down by 5, 10, and 25 years. July is consistently among the top for VIX moves higher. Only the dreaded September is similar.
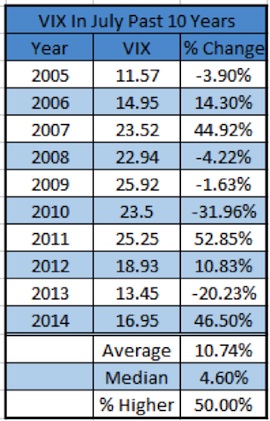
Lastly, here is what the VIX has done the past 10 years. As I mentioned, I first noted this phenomenon last year and we fortunately saw a historic VIX move higher last July.
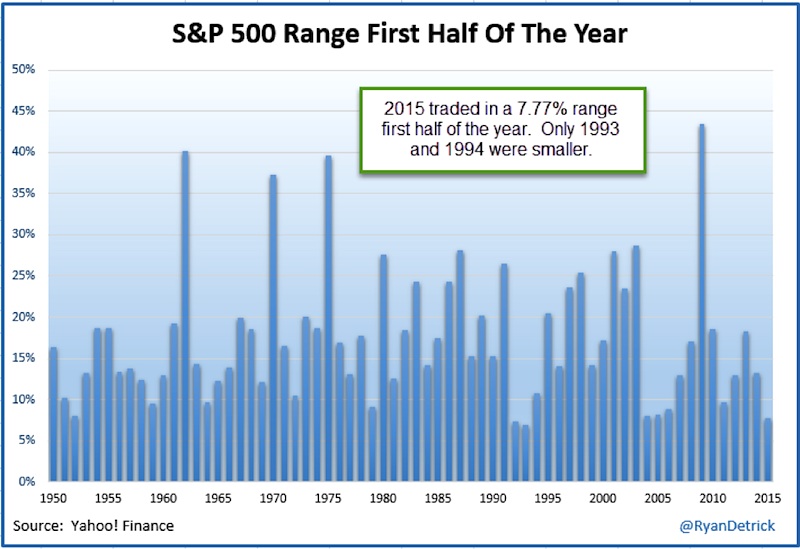
Will history repeat? I will say one thing, things have been historically boring so far this year. In fact, the S&P 500 traded in just a 7.77% range the first six months. Only 1993 and 1994 saw smaller ranges.
We won’t stay in a boring range forever and history says it could be the volatile July to make it happen.
Thanks for reading and good luck out there.
Twitter: @RyanDetrick
Any opinions expressed herein are solely those of the author, and do not in any way represent the views or opinions of any other person or entity.
")


 Rolling Over At Key Fibonacci Level?")
