Using long-term moving averages in one’s technical analysis can be a helpful tool in deciphering trend direction and areas of potential support or resistance. Although they rarely turn out to be perfect inflection points, they can provide guideposts for those inclined to take a more active approach to portfolio management.
More recently, the sideways grind in the major averages has created a narrowing of the percentage difference between the current price and the long-term moving average (200 day ma). I think it’s important to point out this effect and its potential ramifications for trend followers.
Looking at a chart of the SPDR S&P 500 ETF (SPY), it’s easy to see that little forward progress has been made this year. Nevertheless, the 200-day simple moving average (smooth red line on the chart) has been steadily moving higher as it continually adjusts to the higher prices in the market.
S&P 500 ETF (SPY) Chart
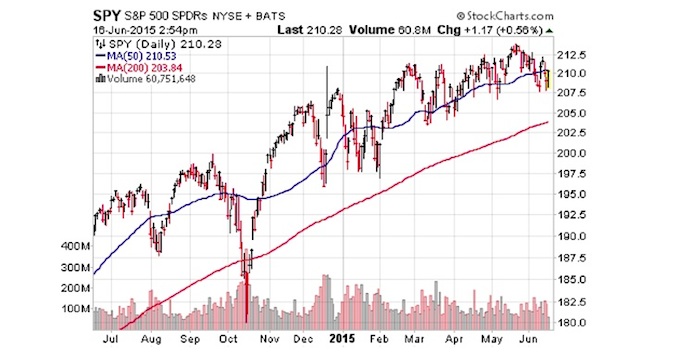
The 200 day moving average of SPY started the year near 193 and is now sitting at 204. That represents an increase of approximately 1.8 points per month and has now narrowed the spread to less than 3% below the current price of the S&P 500 ETF.
TRANSLATION: Those that use the 200-day moving average as a buy and sell signal would be forced to liquidate their positions if the market fell just 3%.
That’s a pretty narrow margin of differential that will have to be evaluated in the context of your personal investing risk tolerance and long-term game plan.
There are three things that could happen from this point:
- Stocks blast off from here and give us some breathing room between the price of SPY and the 200-day moving average.
- Stocks continue to trade sideways for another 3-4 months until the price of SPY seemingly runs into the 200-day moving average.
- Stocks drop and cross below the 200-day moving average, which would ultimately force a decision on reducing exposure or not.
Obviously those that are fully invested would prefer option one. However, the other scenarios are also quite likely as well and must be evaluated accordingly.
The most dangerous situation for trend followers is a quick drop that culminates in a whipsaw back to the highs. This scenario unfolded back in October 2014, when the S&P 500 spent four trading days below the 200-day moving average and then quickly recovered. Those that sold likely found it difficult to put money back to work in stocks or were forced to add back at even higher prices.
Nevertheless, this is trade off in risk that you assume when you implement stop losses to protect your capital. Risk management can be a double edged sword.
My personal preference at this stage is to give stocks more leeway for at least a modest pullback. A 5-6% dip would put SPY near its January lows and make for a more natural zone of support. This level would more than likely carry greater weight than the long-term moving average at this juncture.
Of course, your own personal investing game plan should be dependent on your current exposure, cost basis, and risk tolerance. Every pullback should be independently evaluated according to how you are positioned heading into it. Many times these are excellent opportunities to put new money to work in areas of the market that have been on your watchlist as well.
Get more insights from David’s investment blog.
Twitter: @fabiancapital
No position in any of the securities mentioned at the time of publication. Any opinions expressed herein are solely those of the author, and do not in any way represent the views or opinions of any other person or entity.
 Rolling Over At Key Fibonacci Level?")


