This year’s stock market correction seems to be hitting the bulls harder than others. And if we include October 2014 in the mix (-9.8%), this is the 3rd market correction in 18 months – so that surely has to something to do with it. Investor sentiment readings are near extremes and many are beginning to think that the worst is yet to come. It feels a lot like 2011. And the chart looks a bit similar to 2011 too.
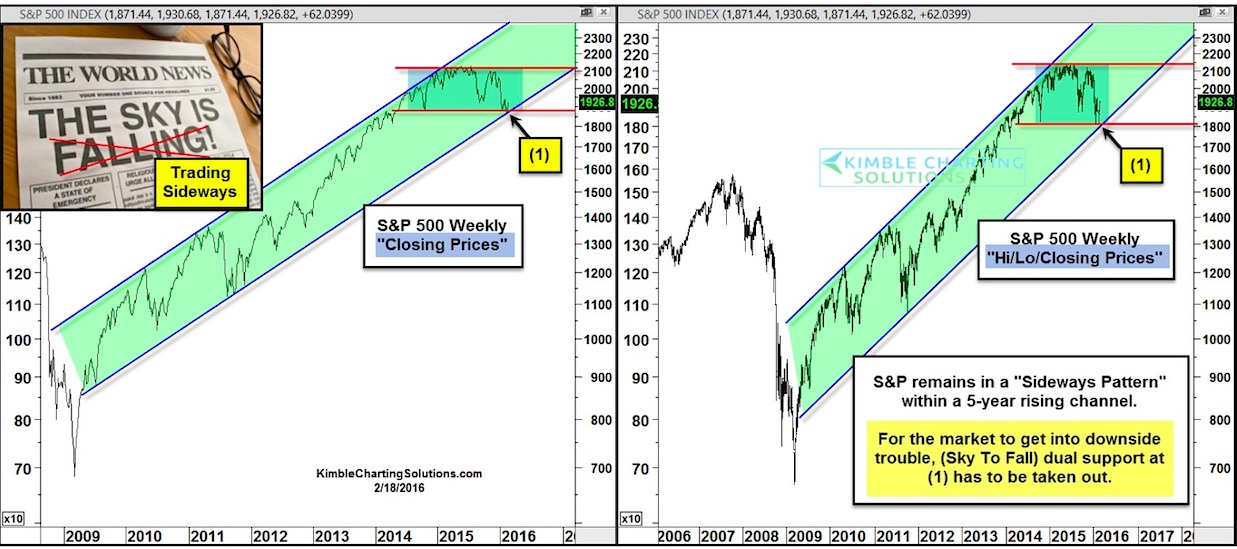
The chart above looks at the S&P 500 Index on both a closing basis” and a high-low-close. In either case, you can see the series of lower highs and lower lows, which is concerning. BUT, the chart is still within the confines of the uptrend, touching near the lower channel support with the current market correction.
As well, these lower highs and lower lows have also taken place within a sideways channel.
Where the uptrend line and the sideways support line meet is point (1) on the chart. And this support is critical to the bulls.
There is still time for the market to heal its wounds and for the market correction to reverse, BUT this support must hold.
On the flip side, a bear market may ensue if the 1,800 level is taken out. That’s our line in the sand. The upper price resistance to watch is 2,100. And until one of these levels is broken, the market is simply moving sideways.
Stay tuned and thanks for reading.
Read more from Chris: “Dow Jones Transportation Average Showing Signs Of Life“
Twitter: @KimbleCharting
The author does not have a position in the mentioned security at the time of publication. Any opinions expressed herein are solely those of the author, and do not in any way represent the views or opinions of any other person or entity.

: Cup (and Maybe Handle) Watch")
 Trading Near Top Of Price Range")

