The fear trade has been one of the most successful avenues for investors to take part in this year. Treasury bonds, gold, utilities, consumer staples, and REITs have all been a big contributor to outsized gains versus a traditional basket of diversified stocks and bonds.
These sectors are well-known defensive plays that tend to perk up during periods of duress in stocks or as interest rates fall. They are also beloved by income investors as a meaningful pickup in yield versus a conventional Treasury bond or S&P 500 Index fund.
Some say this trade has been driven by investors calling the bluff of the Fed raising interest rates. Others may point to bearish sentiment or momentum as a primary driver of asset flows. Whatever the case may be, these individual sectors became extremely crowded near the middle of the third quarter and we are now starting to see some of that strength unwind.
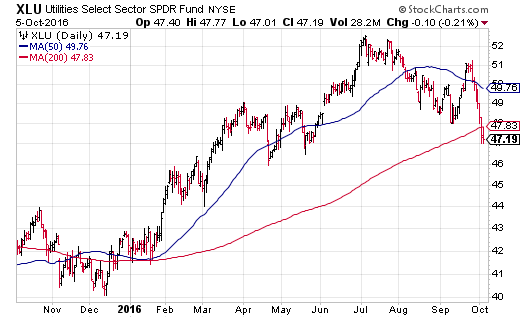
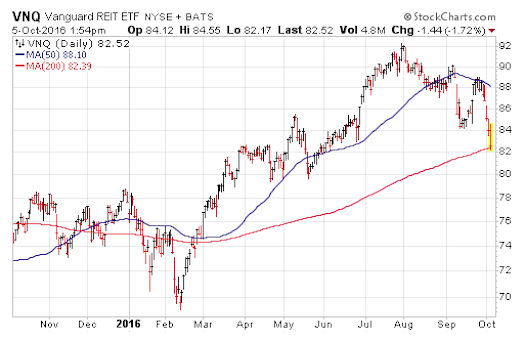
The Utilities Select Sector SPDR (NYSEARCA:XLU) and Vanguard REIT ETF (NYSEARCA:VNQ) just recently sliced through their 200-day moving averages as noted on the charts below.
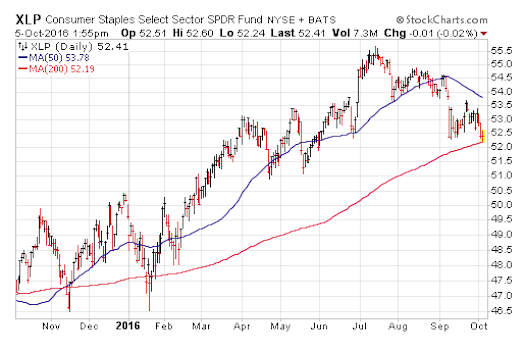
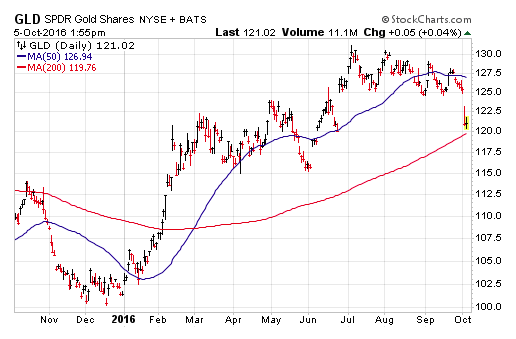
Furthermore, the Consumer Staples Select Sector SPDR (NYSEARCA:XLP) and SPDR Gold Shares ETF (NYSEARCA:GLD) both appear poised to flirt with their long-term moving averages as well.
It’s too early to tell if this is just some hot money unwinding from an overcrowded area of the market or if a more prominent change is taking place. It is worth noting that previously hated sectors such as financials and energy are starting to attract strength in recent months. That bodes well for high-beta and value-focused indexes and will lead to weakening support for low volatility groups.
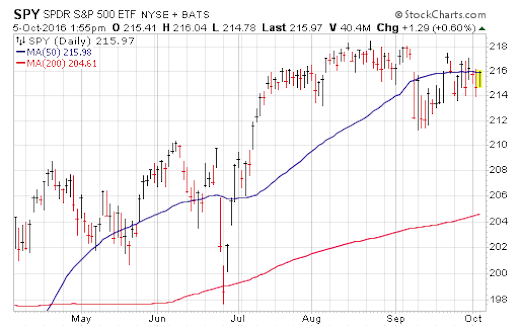
All of this churning under the surface has generated a consolidation phase in broad indexes such as the SPDR S&P 500 ETF (NYSEARCA:SPY). As one sector loses its momentum, another takes off, which creates mostly sideways price action. I view this as a healthy sign overall that the market is continuing to remain resilient and allow for fresh themes to take hold. The trend and overall tenor remains in a bullish pattern until price dictates otherwise.
I have noted several times over the last few months in both my chart review videos and weekly blog posts about the poor risk-to-reward setup in interest rate sensitive asset classes. Now we are starting to see some of that overwhelmingly bullish sentiment and stretched prices unwind in an orderly fashion. It’s also important to note that credit-sensitive asset classes such as high yield debt, bank loans, and emerging market bonds are still holding up quite well.
These changes can create opportunities for those who are inclined to take a more active approach in their portfolios. My advice, as always, is to make incremental adjustments to reduce risk or capitalize on a developing trend.
Thanks for reading.
Twitter: @fabiancapital
Read more on Dave’s Blog.
The author of his clients may hold positions in mentioned securities. Any opinions expressed herein are solely those of the author, and do not in any way represent the views or opinions of any other person or entity.


