 While the S&P 500 breaks through 1900 and traders rejoice over the fresh new high, it seems the same level of excitement is not being felt in other parts of the market. There are multiple divergences that are taking place and showing a lack of confirmation. On my blog I’ve discussed multiple times the lack of participation in momentum for the S&P 500, but we can also see divergences in bonds, small caps, and defensive sectors showing leadership. However, the two measures we are seeing excessive risk taking in are the Put/Call Ratios and the Volatility Index which is sitting at historical lows. The other measures I follow appear to be negatively diverging from the overall equity market. Below are some examples.
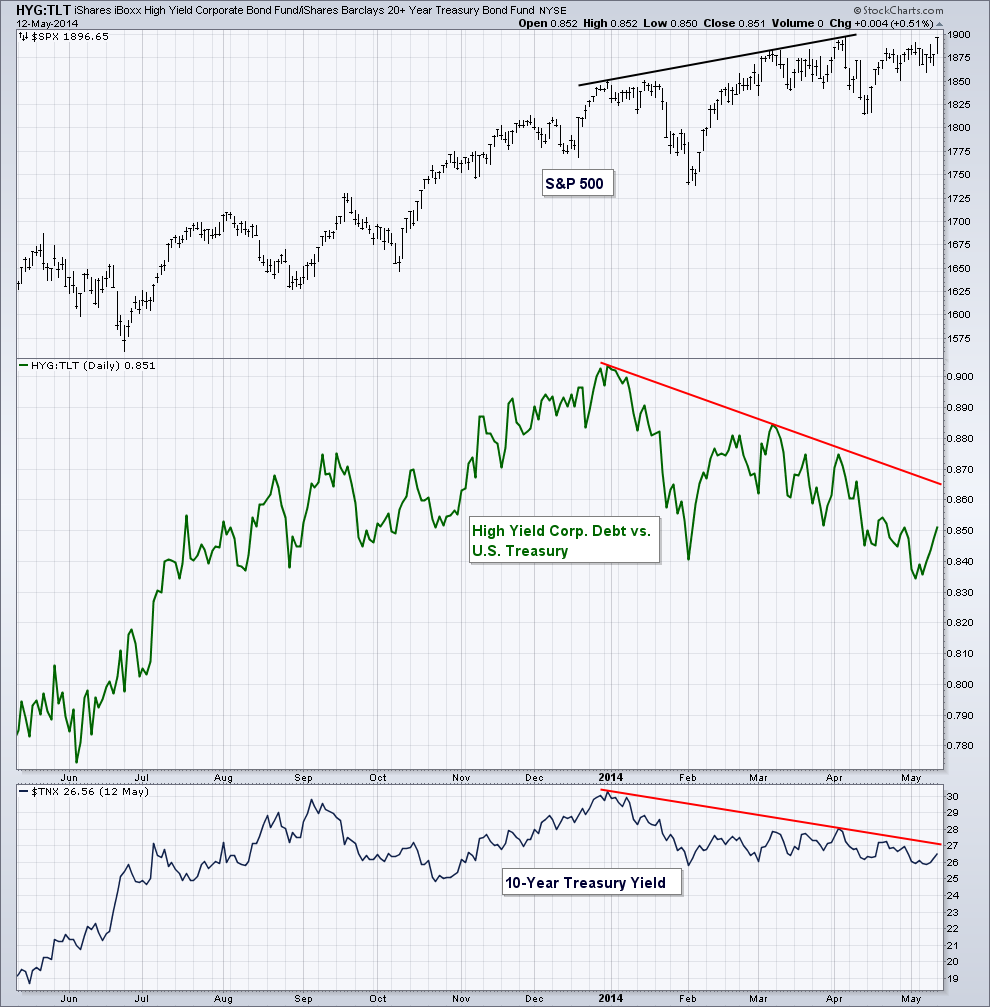
Below is a chart I referenced earlier this year; it shows relative performance of High Yield Corporate Bonds (HYG) vs. U.S. 20+ Year Treasury’s (TLT). In the bottom panel we have the 10-Year Treasury Yield (TNX). For the bulk of the current bull market we’ve seen these two measurements for the bond market confirm the movements in equity prices. As stocks go up, so does the ratio between HYG and TLT as investors show preference for the more risky high yield market over government debt, and same for the 10-Year Yield which often moves with the stock market. However, that’s now the case today. We have a glaring divergence forming in both measures of risk within the bond market, something we haven’t seen since the 2011 and 2012 highs.
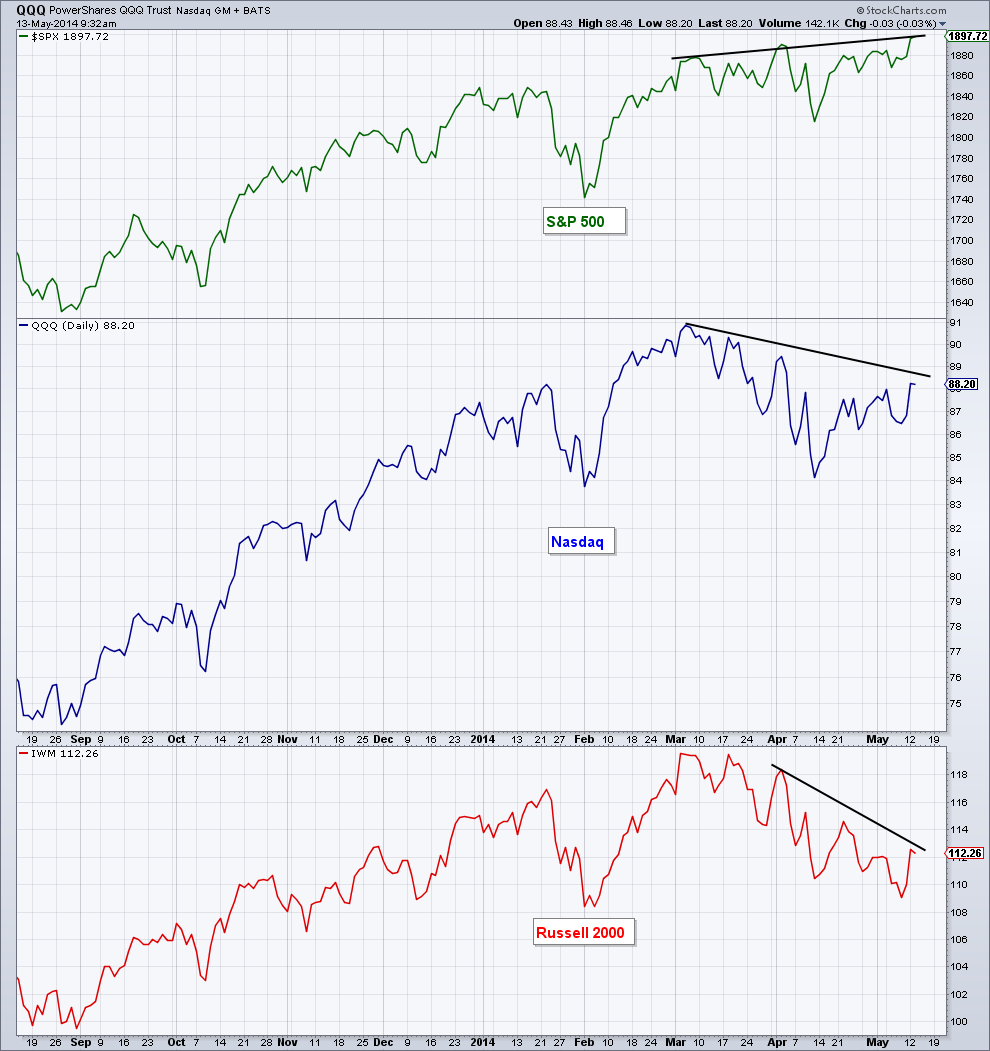
Next we have a chart showing the S&P 500 (SPX), PowerShares Nasdaq (QQQ), and the Russell 2000 iShares (IWM). While the S&P hits new highs the Nasdaq and Russell 2000 are off nearly 5% from their 52-week highs. SentimenTrader.com wrote in a recent note that some examples of past instances of this occurring are: 1983, 1987, 1990, 1998, 2000, and 2006. Jason wrote that the eventual ‘reaction’ of this divergence in the S&P 500 varies in length, “from immediately (’83, ‘90’, ’00) to over a year (’06). If traders were feeling more confident in the upswing in stocks, why aren’t they bidding up these higher beta indices?
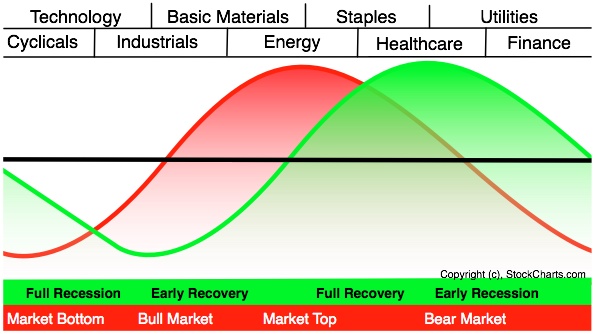
When we look at the sectors that have been leading this year, which is something I do each week in my Technical Market Outlook post on my blog, we can see a lack of confirmation there as well. The best performing sector YTD is Utilities, followed by Energy, Health Care, Materials, and Consumer Staples. John Murphy, who is well known for his intermarket analysis work, believes the sectors that are leading the market provide key insight into where we are in the business and market cycle. Below is the chart he created to help show this. The red curve shows the equity market and that historically the Materials, Energy, and Consumer Staples sectors have been leaders at market highs. In a recent piece for the Wall Street Journal, Lance Stonecypher, Ned Davis Research’s Chief Sector Strategist said that the current “rotation away from market leaders has led to more-modest broad market declines of 5% to 12%” when the economy is more stable. He went on to say that “it is an early-warning sing that the market is vulnerable because the psychology is starting to change. It means expectations got overblown.”
 Source: StockCharts
While these relationships and divergences concern me, I do not believe they can be used to call an exact top to the stock market. What they do tell us is that something appears to be changing in market. And while traders are pushing the major indices to new highs, the underlying sectors and markets are not acting as bullish. Will the bearish seasonality of the summer put a stop to the current uptrend in stocks? Maybe. I’ll allow price to answer that question; however, the above intermarket analysis does appear to be trying to tell us something.
Disclaimer: The information contained in this article should not be construed as investment advice, research, or an offer to buy or sell securities. Everything written here is meant for educational and entertainment purposes only. I or my affiliates may hold positions in securities mentioned.
Any opinions expressed herein are solely those of the author, and do not in any way represent the views or opinions of any other person or entity.


