The Russell 2000 and small caps stocks spent 2015 largely underperforming their large cap brethren (i.e. the S&P 500). And that has brought the Russell 2000 Index (RUT) to a critical test.
In fact, this could be the most important test for the RUT since 2013.
To illustrate this (and eliminate any recency bias), I’ve inverted the chart of the Russell 2000 (see below). As you may recall, I’ve written about the value of inverting market charts a couple times in the past.
So as you read on, keep in mind that the analysis is “flipped” as well.
As we head into 2016, the small caps index is testing dual resistance at point (1) below. And note that one of the resistance lines could be the top of a bullish ascending triangle formation.
If small caps take out this resistance at point (1), the measured move suggests the index could reach the 930 level.
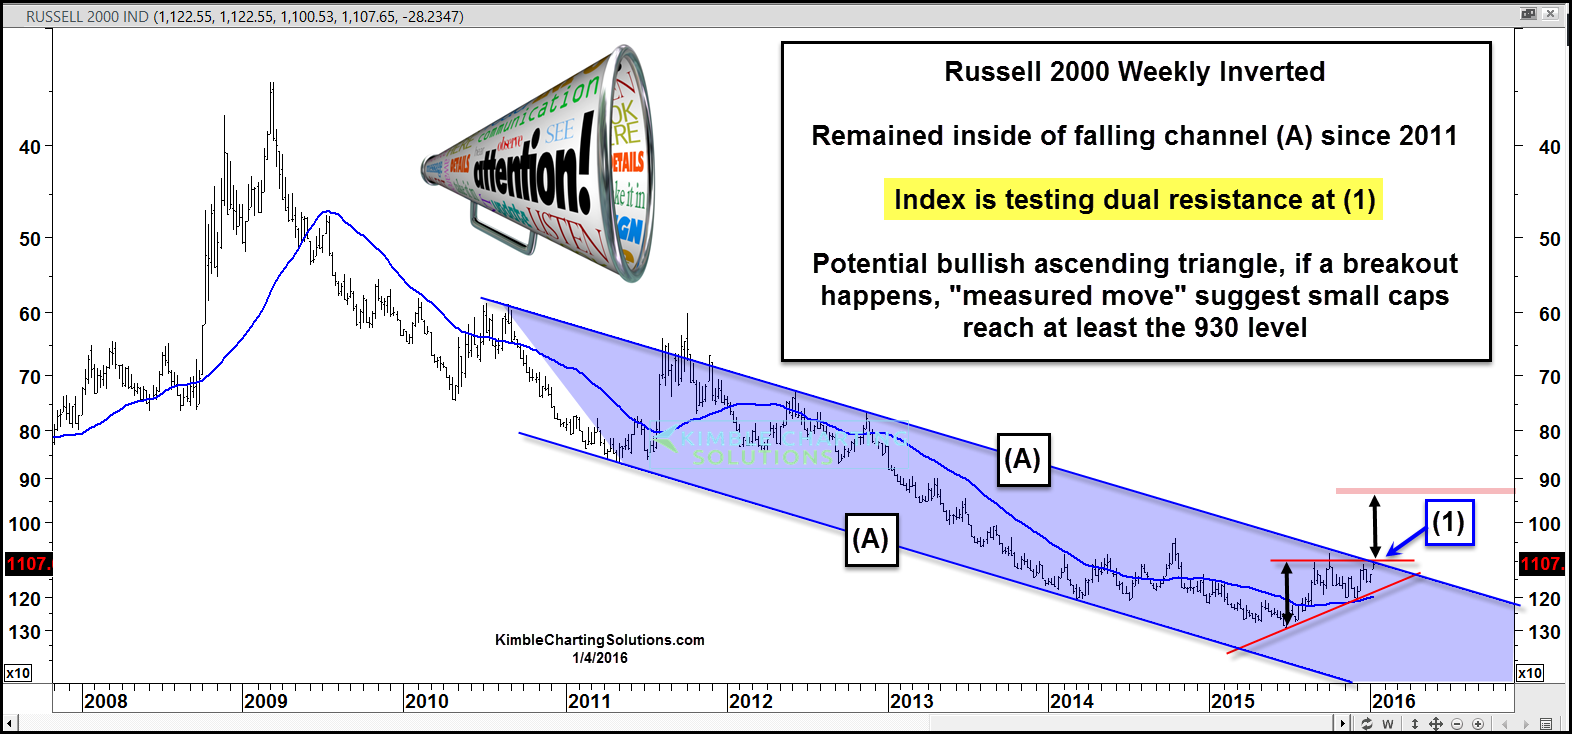
For years it has paid to “go long” at the top of this inverted falling channel, as resistance is resistance (or on a regular chart of the Russell 2000, support is support) until broken.
A multi-year trend is being tested at the start of this year. If the inverted channel is broken to the upside, it would be the first time in years.
Thanks for reading.
Twitter: @KimbleCharting
The author does not have a position in the mentioned security at the time of publication. Any opinions expressed herein are solely those of the author, and do not in any way represent the views or opinions of any other person or entity.

: Showing Some Signs of Emerging Strength")
