Last week, investors watched the S&P 500 grind higher, pushing the index into unchartered territory: the land of all time highs. And with the major stock market indices pushing higher in unison, it has many wondering what will stop this bull? Well, there are a few levels to watch over the near-term, and especially for traders.
And each has to do with S&P 500 fibonacci extension levels. However, one is a major technical level that demands our attention.
Last week, I shared a couple of near-term fibonacci targets that active investors should keep their eyes on: 2124 and 2163 on the S&P 500. We are nearing 2124 and may touch that level this week. But there’s an even more important level to put on your radar. It was first brought to my attention by Nicola Duke (@NicTrades):
@andrewnyquist @seeitmarket check the 1.618 of the 07 highs to 09 lows … right in the mix and that one is key IMO
— Nicola Duke (@NicTrades) February 18, 2015
In the chart below, you can see that the 1.618 S&P 500 Fibonacci extension comes in at 2138.
S&P 500 Monthly Chart
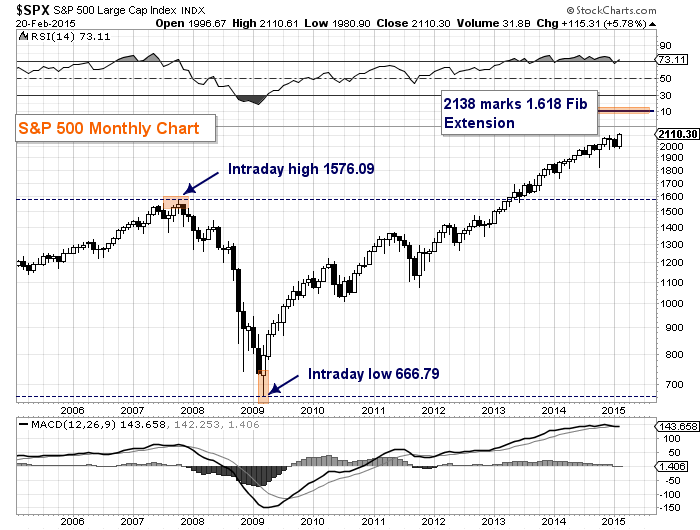
I agree with Nicola that this level (+/- 10 points) should be watched closely. I’ve watched “price” for so long that it’s probably better to say that investors should watch the behavior of the price action if/when the S&P 500 approaches this level. Thanks for reading.
Follow Andy on Twitter: @andrewnyquist
No position in any of the mentioned securities at the time of publication. Any opinions expressed herein are solely those of the author, and do not in any way represent the views or opinions of any other person or entity.


