by Jesse Felder
“I have no special talent. I am only passionately curious.” -Einstein
This quote sums up my investment expertise very well. I have no degree in finance, no acronyms after my name to signify any professional designations, no certification in technical analysis or any real investment specialization at all. I have, however, spent over 20 years studying all of these things and more and, for better or worse, applying them directly to my investment process. I guess you could call me a, ‘jack of all trades (pun intended), master of none.’
I have been “passionately curious” about the stock market since I was 8 years old when my dad bought an Apple IIe and gave me a game called, “Millionaire.” It was an early stock market simulator and from that point I was hooked. Since then I’ve studied the process of every “Market Wizard” I could find from Paul Tudor Jones to Warren Buffett, distilling and integrating what I could into my own investment methods.
Fundamentally, like Buffett, I generally restrict myself to the highest quality companies in the world whose businesses I can easily understand. Joel Greenblatt, in his books, does a good job of defining these as companies who consistently earn a very high return on invested capital. American Express (AXP), Apple (AAPL), Google (GOOGL), Johnson & Johnson (JNJ), Mastercard (MA), Nike (NKE) and Starbucks (SBUX) are all good examples. Over time, these companies have proven that they will outperform the businesses of lesser rivals and this usually is reflected in the performance of their stock prices.
Ideally, I’d like to buy these sorts of companies at a bargain price but what constitutes a bargain? Ultimately, I’d like a return that is attractive relative to alternatives (like the risk-free rate) and near the high-end of the company’s range over its trading history. In other words, if a company over the past 20 years has seen its share price trade anywhere from 7-12 times EV/EBITDA (my favorite valuation measure) I’d want to pay close to the low-end of that range.
Apple provides a good example of this. A little over a year ago I wrote my most popular blog post ever, “Mr. Market Is Not Impressed With Apple (And Why He’s Wrong)” in which I argued that the stock was historically very cheap:
So let’s take a look at what investors are really paying for in Apple’s shares today. The current market capitalization is $422 billion (938 million shares times $453 per share). Back out the cash of $137 billion and you get an enterprise value of $285 billion. That amounts to a mere 6 times the company’s free cash flow over the past twelve months. In other words, investors get a 16.6% free cash flow return on their investment at the current share price. What’s more, Apple, on an enterprise value to EBITDA measure, is now cheaper than the likes of Microsoft and Radio Shack. Even when you don’t back out the cash in its bank accounts the stock currently trades at its cheapest valuation at any time over the past decade. Over that time, Apple’s stock price has typically found a bottom near 10 times gross cash flow. In 2011, it bottomed at 8.5 times cash flow before running 75% higher over the next 12 months. Today, it trades at 7.5 times cash flow. Any way you slice it that’s damn cheap and for one of the most admired brands/most profitable companies in history.
Since then the stock has risen over 30% and I still think it’s cheap. The bottom line is investors need to pay attention to the bottom line and ‘the price you pay determines your rate of return.’
In addition to traditional investment analysis like this, though, I like to employ some basic technical analysis. Google’s price action in 2012 is a good example of this. Google is a fantastic company. The other day I think I heard someone say they’ve created the most profitable advertising business in the world and that’s a good way to think about it. Search advertising is a money printing machine with very little cost involved. It’s a fabulous business.
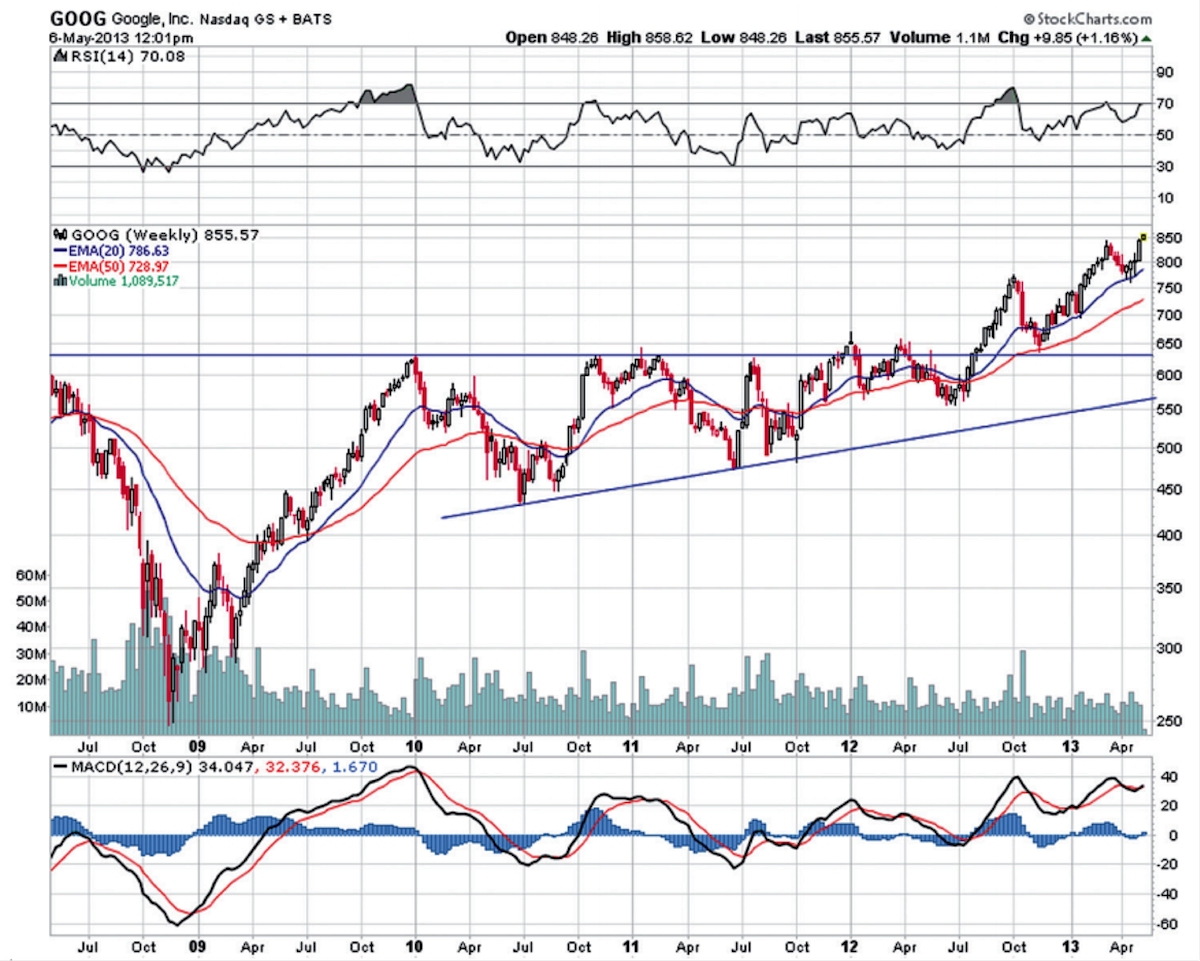
But enough about the fundamentals, what drew me to the stock back in 2012 was the chart. Google’s stock had been testing the $635 resistance area for over two years before finally breaking out above it in the summer of 2012. Then that Fall the stock came back to test the breakout level. For me this was a classic bullish setup that ended up working beautifully.
Many investors are one-dimensional, meaning they either look at the fundamentals or the technicals in their investing or trading process. I believe that being multi-dimensional, employing both, is critical in being successful in today’s markets and, for this reason, I don’t limit myself to just these two. I also try to incorporate sentiment, top-down and macro/structural elements.
You don’t need to be a certified expert in any one of these areas to employ them in your own process. Modeling the successful techniques of the world’s greatest investors will do wonders for your results. And it really helps to be “passionately curious.”
About Jesse Felder: Jesse has been managing money for over 20 years. He began his professional career at Bear, Stearns & Co. and later co-founded a multi-billion-dollar hedge fund firm headquartered in Santa Monica, California. He currently works with a select group of clients at Felder & Company, LLC in Bend, Oregon. Read more of Jesse’s market commentary over at The Felder Report. You can also follow Jesse on StockTwits and Twitter: @jessefelder
Any opinions expressed herein are solely those of the author, and do not in any way represent the views or opinions of any other person or entity.
")


")
