Many market participants and pundits have been discussing how this has been the worst start to a new year for stocks that we’ve ever had. That’s a pretty depressing thought to begin 2016 with!
Unfortunately, there aren’t a lot of current data points out there that brighten the investment landscape right now.
One thing that caught my eye today was new lows for market breadth on a key indicator (more on that below).
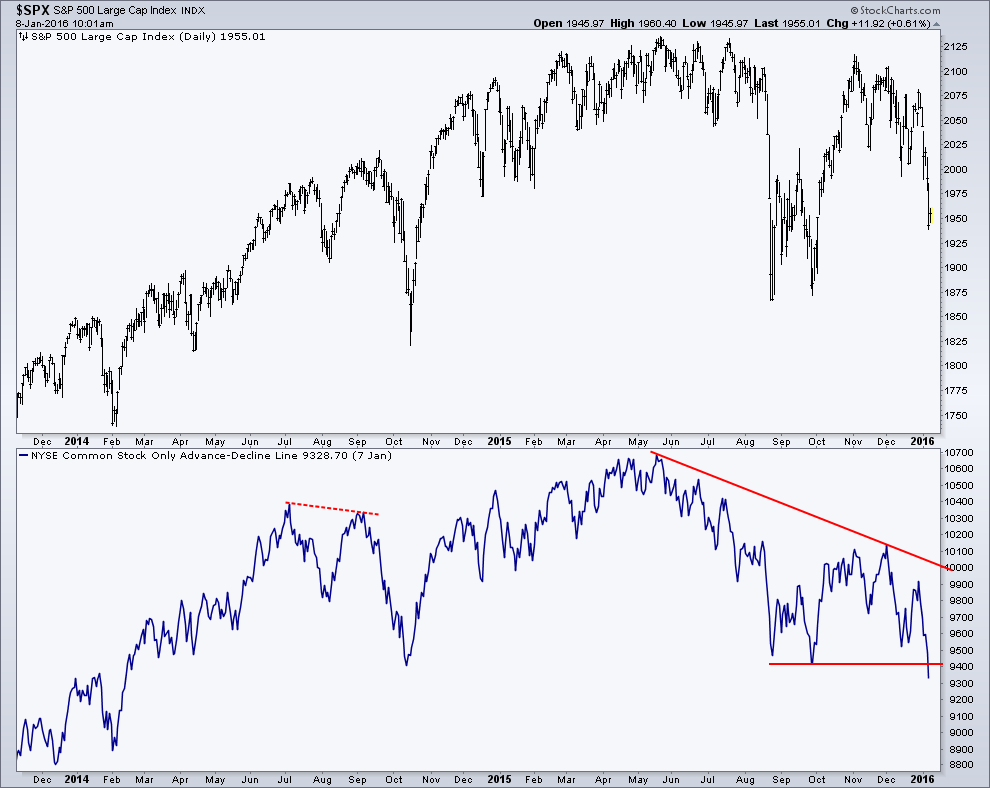
As many of you may know, my main focus when it comes to analyzing sectors and indices is price, momentum, and breadth. Looking at price, I noted on January 4 that for the first time since 2007 and 2008, the S&P 500 had failed when testing its 50-week Moving Average as resistance. This is important because that long-term moving average had helped ‘define’ the uptrend into the 2007 peak as well as the current bull market up trend we are (or where?) in now. When support becomes resistance, that’s a sign that the market mentality is potentially shifting.
On January 8th I tweeted a chart showing the NYSE Common Stock-Only Advance-Decline Line. This is a measure of the equity markets breadth, or amount of participation in a trend. The more stocks advancing, the higher this indicator will rise. This tool becomes important when its behavior deviates from that of the underlying market, i.e. U.S. equities. With this recent sell-off in stocks, this Advance-Decline line has fallen below its prior August low, while stocks still remain above their own respective August level. In short, new lows for market breadth have come fast.
So is this important?
Looking back at previous times we’ve seen this measure of market breadth break below a prior low before the market itself does, there haven’t been very many examples. Most recently we saw this happen in 2014 during the sell-off in September. Price eventually ‘caught up’ and broke its prior low as well.
In this instance, the A-D Line was in essence, foreshadowing the coming price movement in the indices. Going back further, I don’t see any other times of this occurring until we get to late 2007. After the market made its top, we saw the NYSE Common Stock-Only Advance-Decline Line get ahead of price on the downside in November of ’07 as more stocks were declining than what price was reflecting. Making new lows for market breadth wasn’t a good indication then eith
The data for this indicator only goes back to 2003 at StockCharts.com, so that’s as far back as I’m able to look as I write this and I don’t see any other major instances of this breadth downside ‘front running’ occurring. With breadth falling faster than price, we know that more stocks are weakening which is not a good sign for U.S. equities going forward. This is something I’ll be keeping a close eye on in the coming weeks.
Thanks for reading.
The information contained in this article should not be construed as investment advice, research, or an offer to buy or sell securities. Everything written here is meant for educational and entertainment purposes only. I or my affiliates may hold positions in securities mentioned.
Any opinions expressed herein are solely those of the author, and do not in any way represent the views or opinions of any other person or entity.
Twitter: @AndrewThrasher
Any opinions expressed herein are solely those of the author, and do not in any way represent the views or opinions of any other person or entity.


